Tourism in Calgary: Statistics, Barriers, and Future Outlook

Key Insights
| Data from Open Alberta shows that Calgary received a total of 7.6 million person visits in 2019. The Government of Alberta’s Domestic Visitor Profiles for 2023 show that in 2023, domestic tourism expenditure in Calgary reached 2.9 billion dollars. Tourism Calgary’s Destination Report for 2019 reveals that the city sold a total of 3,378,183 rooms, which is 3.7% higher than the rate in 2018. According to data from the Calgary International Airport, a total of 1,710,000 domestic passengers have been received for 2025, as of February. The same report shows that since 2020, domestic travel peaked in 2023, with a total of 12.7 million passengers received. |
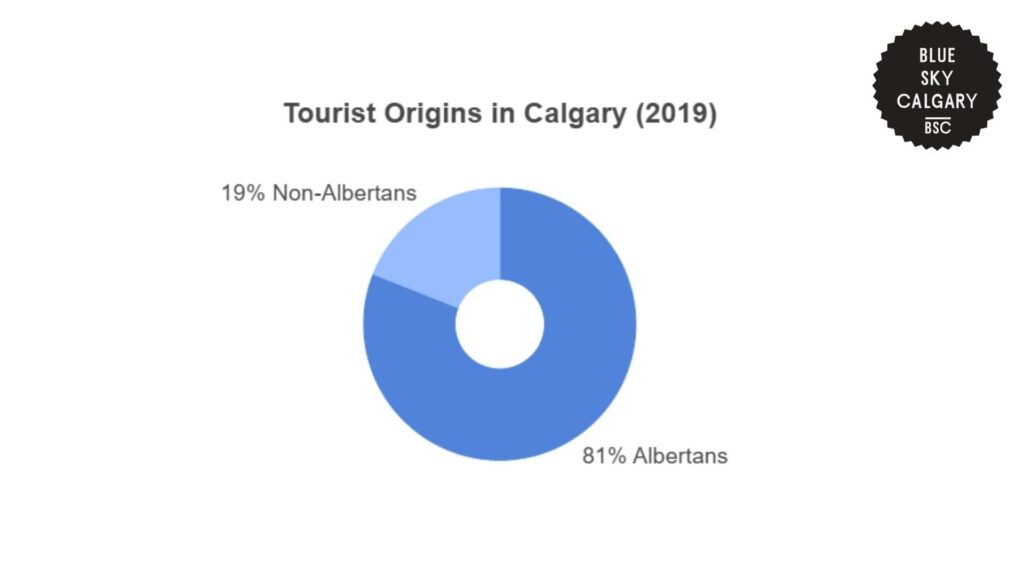
Open Alberta shows that in 2019, Calgary tallied 7.6 million person visits. This makes up 24% of the total number of person visits to Alberta and highlights the city’s position as a key destination in the province’s tourism industry.
The numbers also show that interprovincial dominated domestic tourism in Calgary in 2019. Of the overall visits, 81% were from other Albertans.
This implies that residents traveling within the province generated over 6.1 million visits. In contrast, just 19% of the overall visits come from outside Alberta.
This large proportion of interprovincial travel suggests that Calgary’s tourism sector in 2019 was based largely on local demand, as opposed to long-haul or international visitors.
Calgary’s position as Alberta’s largest city means that it is a weekend destination of choice for local residents, thus attracting higher numbers of tourists.
| Tourism Metrics in Calgary (2019) | Value |
| Total Person Visits | 7.6 million |
| Share of Albertan Visitors | 81% |
| Non-Albertan Visitors | 19% |
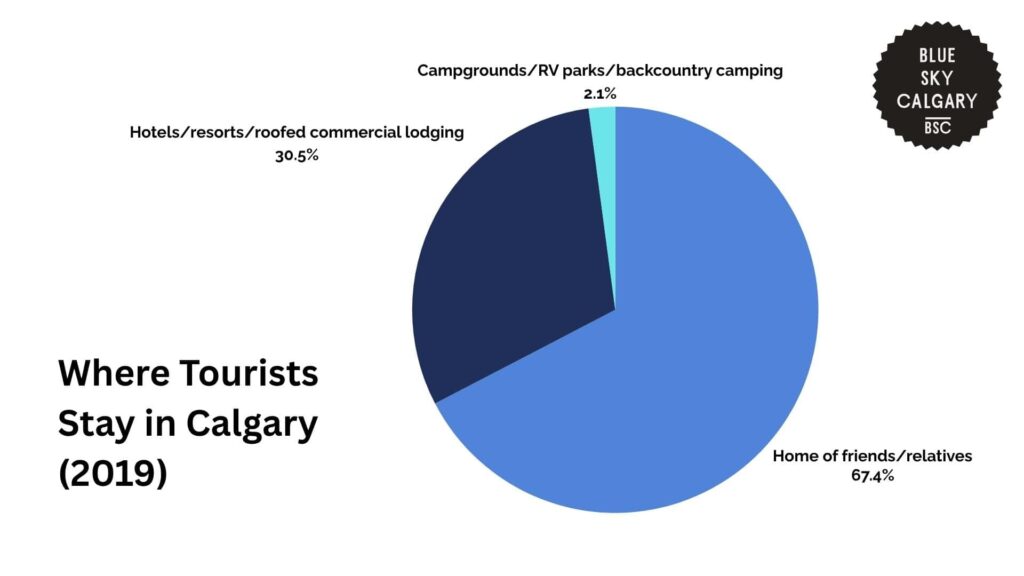
The same report shows that the majority of tourists to Calgary were accommodated in non-commercial facilities. 64% of overnight visitors were accommodated in friends’ or relatives’ homes.
This percentage shows a high dependence on personal contacts for accommodation, which could be attributed to the large concentration of regional and local visitors to the city.
Since 81% of Calgary tourists were Albertans, it is likely that most tourists already had friends and relatives in the city, which decreased the demand for hotel reservations.
Conversely, just 29% of tourists occupied hotels, resorts, or other roofed commercial properties. This implies that although the hospitality industry is strong in Calgary, many visitors avoid paying for shelter in favor of free or cheap options.
Moreover, only 2% occupied campgrounds, RV parks, or practiced backcountry camping. This implies that nature-based accommodations played a small part in the tourism landscape of the city.
| Type of Accommodation | Share of Visitors (%) |
| Home of friends/relatives | 64% |
| Hotels/resorts/roofed commercial lodging | 29% |
| Campgrounds/RV parks/backcountry camping | 2% |
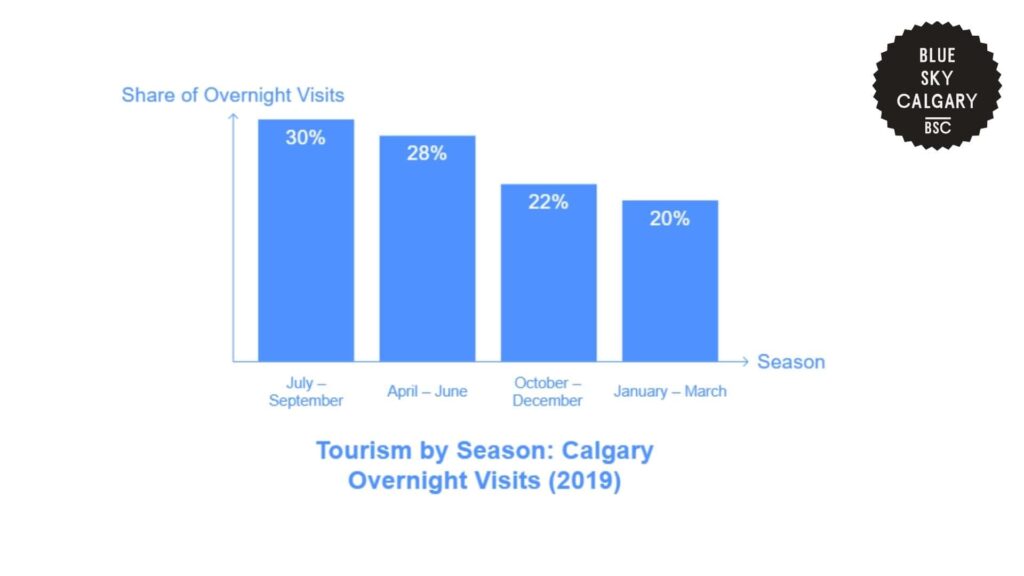
Calgary’s tourism in 2019 was also highly seasonal, with the most overnight visitors coming in the summer.
30% of overnight trips happened between July and September, which is the peak of the travel season. Summer coincides with big festivals in the city and has weather conditions for touring and outdoor recreation.
The second busiest time was spring, as 28% of visits were between April and June. This time of year is probably made popular by the more pleasant weather and cheaper accommodation rates before the peak in the summer.
Autumn, which is from October to December, made up 22% of the visits. Meanwhile, the winter season, January to March, made up 20%.
These figures could be the result of the colder weather and fewer tourism activities during those months.
Overall, this seasonal distribution highlights that Calgary’s tourist demand is the greatest during warmer months.
| Season | Share of Overnight Visits (%) |
| July – September | 30% |
| April – June | 28% |
| October – December | 22% |
| January – March | 20% |
Regional Analysis of Tourism Trends Across Alberta
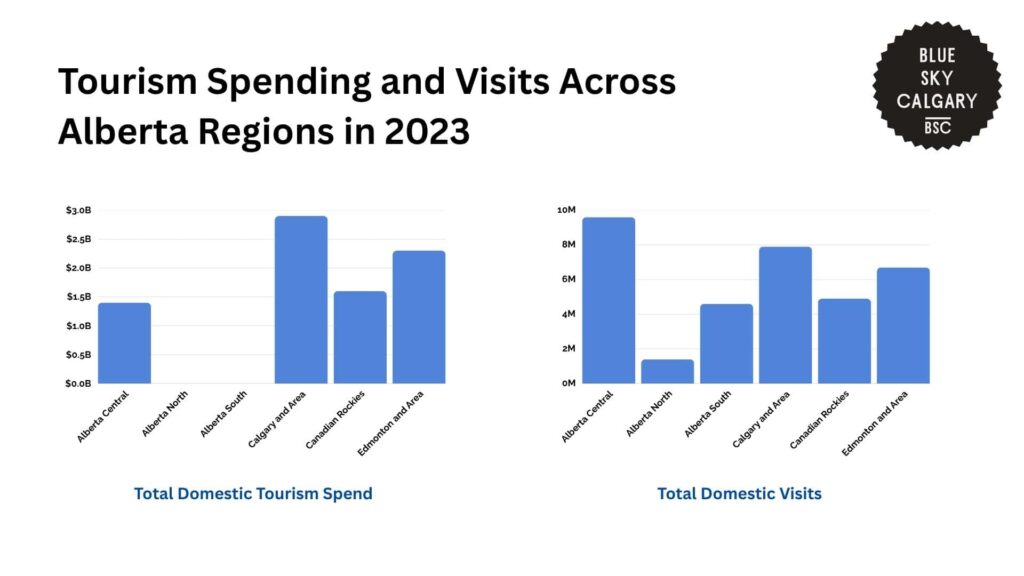
The Government of Alberta’s Domestic Visitor Profiles for 2023 reveal trends in tourism across areas in the province.
Calgary and its surrounding area received a total of 7.9 million domestic visits and had the highest domestic spending in tourism out of all the Albertan provinces in 2023.
Overall, domestic expenditure in Calgary amounted to 2.9 billion dollars, showing that Calgary was the most profitable tourist destination in the province.
This amount put Calgary ahead of Edmonton and its surrounding areas, which had the second-largest domestic tourism spend at 2.3 billion dollars. Edmonton and nearby areas also received a total of 6.7 million domestic visits.
The city’s mix of shopping malls, entertainment, festivals, and business travel adds up to high visitor spending, though its overall volume of visits was less than Calgary’s.
The Canadian Rockies were in third place with 1.6 billion dollars spent by domestic visitors and received a total of 4.9 million visits.
Although this area received much fewer visitors, this high spending is likely due to the price of specialty tourism services like guided hikes, park fees, and luxury accommodations close to natural sites.
Notably, Alberta Central received the most visits at 9.6 million, though domestic spending overall in this region was much lower at only 1.4 billion dollars.
This may be because tourists in Alberta Central often do shorter-term visits or cheaper activities, including day trips or tourist visits to rural areas that do not involve long stays or huge daily expenses.
Meanwhile, Alberta South recorded 4.6 million visits and 939 million dollars worth of domestic spending.
Alberta North had the lowest numbers in each category, at only 1.4 million visits and 407 million dollars in tourism expenditure.
| Area | Total Domestic Tourism Spend | Total Domestic Visits |
| Alberta Central | $1.4B | 9.6M |
| Alberta North | $407M | 1.4M |
| Alberta South | $939M | 4.6M |
| Calgary and Area | $2.9B | 7.9M |
| Canadian Rockies | $1.6B | 4.9M |
| Edmonton and Area | $2.3B | 6.7M |
Hotel Performance Trends in Calgary
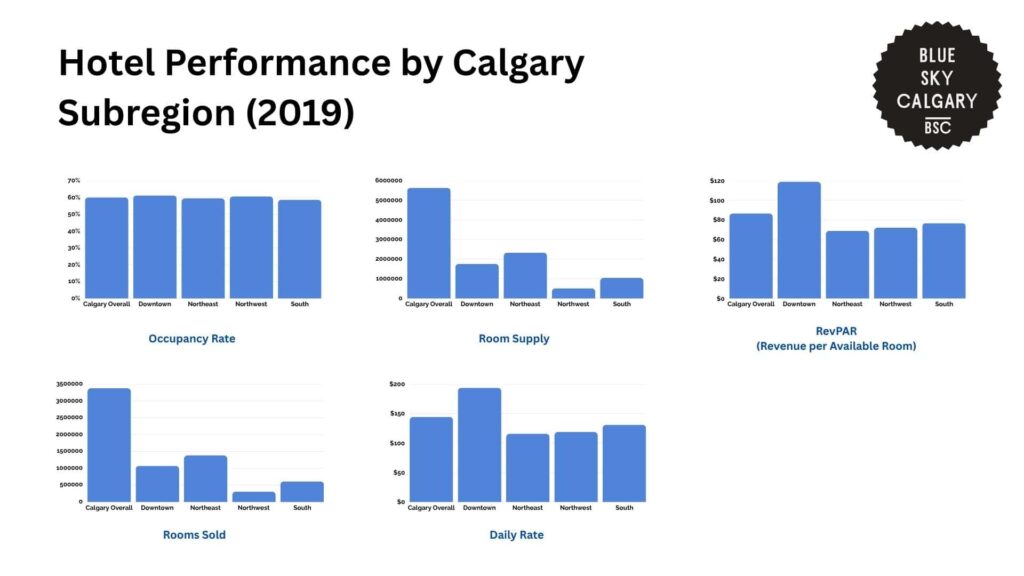
According to Tourism Calgary’s Destination Report for 2019, hotel performance showed a fluctuating trend of demand growth and falling occupancy.
The total number of hotel rooms sold in the whole city amounted to 3,378,183. This was up by 119,564 rooms and is 3.7% higher compared to the earlier year.
Total room supply also increased by 369,870 rooms to 5,633,193 available room nights, which is a 7% rise.
However, the rise in total supply seems to have outpaced the increase in demand, since there was a reduction in the occupancy rate by 3.1 percentage points from 63.1% in 2018 to 60.0% in 2019.
Likewise, the average room rate and RevPAR (Revenue per Available Room) also declined. The average room rate fell by $1.20, from $145.50 to $144.30, while the revenue per available room also dropped to $86.51 from $90.08.
The data also shows variations in the performance of different areas across Calgary.
Downtown Calgary had the highest number of rooms sold, at 1,074,608 room nights. This number is up by 63,354 rooms or 6.3% from the prior year.
Meanwhile, the supply of rooms increased further by 163,937 rooms, to 1,754,905 room nights, which is an increase of 10.3%. However, this made the occupancy percentage drop by 3.7 percentage points, from 64.9% to 61.2%.
Although the drop in the average daily rate of $193.86 was small, at only 0.4%, the region’s revenue per available room dropped by $5.06 to $118.71, which is 4.1% less than the last year.
In the Northeast area, there was a total of 1,382,017 rooms sold. This is an increase of 77,043 rooms, or 5.9%.
Room supply also rose to 2,326,671 rooms, which is an increase of 173,983 rooms, or 8.1%. Meanwhile, the occupancy rate fell from 61.4% to 59.4%, which is a 2.0 percentage point decrease.
The average room rate also dropped by $3.71 to $115.77. Similarly, revenue per available room decreased by $3.68 to $68.75, which is down by 5.1% from the previous year.
The Northwest area had the biggest drop in demand, with only 307,808 rooms sold. This is down 25,507 rooms from the previous year, or a 7.7% decrease.
While room supply increased by 19,152 rooms to 507,715, occupancy dropped by 4.2 percentage points from 64.8% to 60.6%.
However, the daily rate did increase by $1.30 to $118.75. Meanwhile, the revenue per available room declined by $2.31, at $72, which was 3.1% lower than in 2018.
In the South area, there were 611,653 sold rooms, which is a small increase of 2,566 rooms or 0.4%. The room supply rate went up by 51,102 rooms to 1,043,902 rooms, an increase of 5.1%.
The area also saw occupancy decline by 4.5 percentage points, to 58.6% from 63.1%.
Similarly, the average room rate dropped by $1.57, to $130.99, and revenue per available room also went down by $4.65, to $76.66, which is a 5.7% decrease from the last year.
Overall, the numbers show that Calgary hotels sold more rooms than in the previous year but experienced falling occupancy rates and lower revenue in all of its subregions since room supply increased at a higher rate than demand.
| Area | Occupancy Rate | Rooms Sold | Room Supply | Daily Rate | RevPAR(Revenue per Available Room) |
| Calgary Overall | 60.0% (−3.1 pts) | 3,378,183 (+3.7%) | 5,633,193 (+7.0%) | $144.30 (−0.8%) | $86.51 (−4.0%) |
| Downtown | 61.2% (−3.7 pts) | 1,074,608 (+6.3%) | 1,754,905 (+10.3%) | $193.86 (−0.4%) | $118.71 (−4.1%) |
| Northeast | 59.4% (−2.0 pts) | 1,382,017 (+5.9%) | 2,326,671 (+8.1%) | $115.77 (−3.1%) | $68.75 (−5.1%) |
| Northwest | 60.6% (−4.2 pts) | 307,808 (−7.7%) | 507,715 (+3.6%) | $118.75 (+1.1%) | $72.00 (−3.1%) |
| South | 58.6% (−4.5 pts) | 611,653 (+0.4%) | 1,043,902 (+5.1%) | $130.99 (−1.2%) | $76.66 (−5.7%) |
Breakdown of Passenger Origins at the Calgary Airport
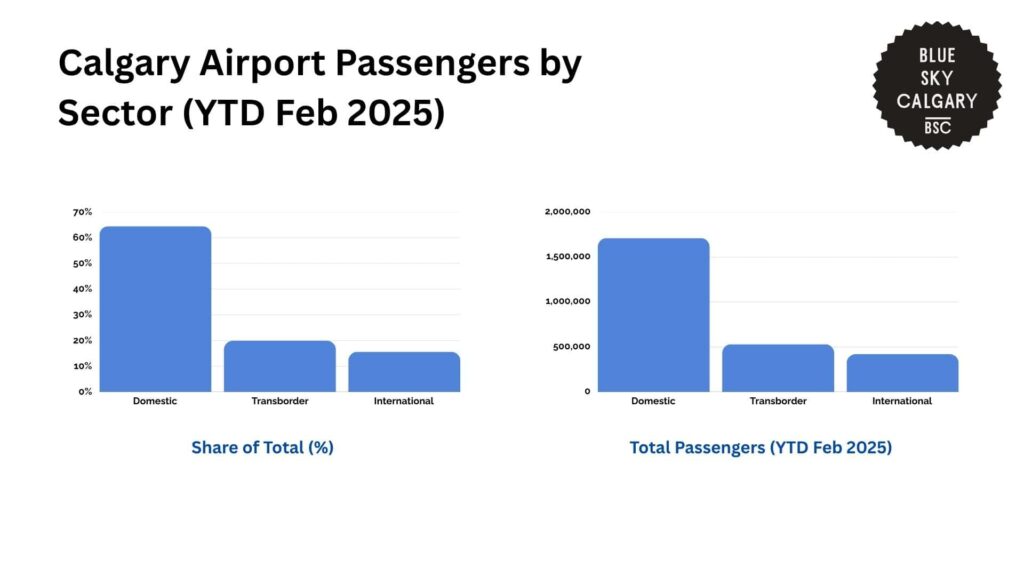
The Calgary International Airport shows that as of February 2025, most passenger activity at Calgary International Airport was domestic.
Of all enplaned and deplaned passengers so far in 2025, 64.5% were traveling within Canada, which is a total of 1,710,000 passengers.
This high domestic activity is indicative of Calgary’s continued position as a main link between other Canadian cities and regions.
The second-largest category was transborder passengers, or those moving between Calgary and destinations within the United States.
They accounted for 19.9% of all traffic, with 530,000 individuals. This large number indicates consistent demand for cross-border links, though at lower levels than that of domestic travel.
International travelers, or those traveling to or from points outside North America, accounted for 15.6% of all passengers, which makes up 420,000 people.
Although this is the smallest portion in terms of volume, it is still a significant percentage of overall airport activity.
| Passenger Type | Share of Total (%) | Total Passengers (YTD Feb 2025) |
| Domestic | 64.50% | 1,710,000 |
| Transborder | 19.90% | 530,000 |
| International | 15.60% | 420,000 |
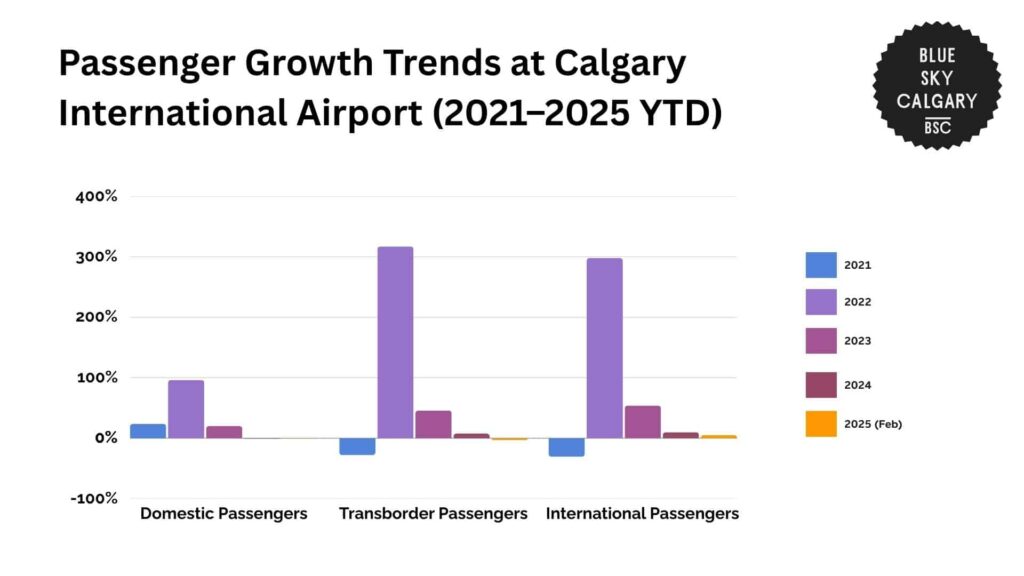
Passenger numbers at Calgary International Airport have also seen dramatic changes since 2021.
Domestic travel was at 12.7 million in 2023, which is the highest yearly level in the period between 2021 and 2025.
In 2024, volumes fell slightly by 0.75% to 12.6 million. As of February 2025, there have been 1,708,846 passengers recorded, which is down 0.54% from the equivalent point of the previous year.
Though the decline is still pretty small, this is the second year of slowing growth after a 96.42% jump in 2022. This decelerating growth suggests that the domestic travel industry is stabilizing after its sharp recovery from the pandemic.
Transborder travel saw the largest increase in 2022, growing by 316.95% from the year before. In 2023, this grew by another 45.90%, though momentum was lost in 2024, with only a 7.73% growth.
As of February 2025, 526,404 transborder passengers have been tallied, which is down 2.74% from the previous year. This recent decline could be an indication of a shift in cross-border travel demand.
International passenger traffic also recovered strongly, increasing by 297.98% in 2022 and by 54.05% in 2023.
Growth remained at 10.00% in 2024, and current data for early 2025 indicates 416,008 passengers, which is a 5.40% year-over-year increase.
| 2021 | 2022 | 2023 | 2024 | 2025 (Feb) | ||
| Domestic Passengers | Total (YTD) | 12,699,708 | 12,604,237 | 1,708,846 | ||
| Change from Previous Year | 23.91% | 96.42% | 20.25% | -0.75% | -0.54% | |
| Transborder Passengers | Total (YTD) | 3,586,287 | 3,863,649 | 526,404 | ||
| Change from Previous Year | -27.92% | 316.95% | 45.90% | 7.73% | -2.74% | |
| International Passengers | Total (YTD) | 2,207,52 | 2,428,198 | 416,008 | ||
| Change from Previous Year | -30.50% | 297.98% | 54.05% | 10.00% | 5.40% |
Costs and Consequences of Weak Tourism Policies in Calgary
Canada’s tourism sector remains an important part of the country’s economy. However, the Tourism Industry Association of Canada shows that certain policies disadvantage the tourism industry and slow down its growth.
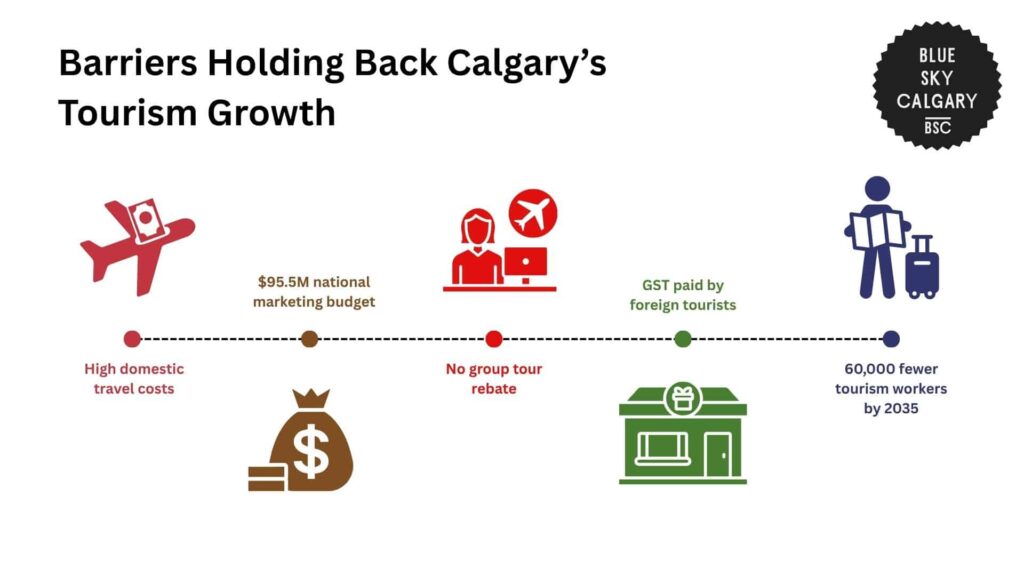
One of the main challenges faced by the country is the expense of domestic travel. Canada’s large geography makes regional travel more costly, and the shortage of extensive low-cost air travel further constrains accessibility.
Calgary’s location makes it a prime gateway to Alberta and the Canadian Rockies, but high airfares and limited low-cost travel choices make it hard for international tourists to incorporate Calgary into larger cross-country trips.
The absence of a national plan to enhance regional air links drives up the cost of inter-provincial travel, which affects multi-city travel.
Canada’s tax system also undermines Calgary’s standing in the international tourism economy. In contrast to most competing nations, Canada does not zero-rate tourism services for international tourists.
Consequently, international tourists pay Goods and Services Tax (GST) on hotel accommodations and travel services in Calgary, although these purchases qualify as export services in most international tourism economies.
The removal of the accommodation rebate for foreign tour operators has also discouraged group travel organizers from booking Canadian destinations.
For Calgary, this lowers potential group sales for conventions, meetings, and incentive travel programs.
Marketing expenditure is another problem that needs to be addressed. Calgary is dependent on national branding initiatives to stimulate awareness in international markets.
However, Destination Canada’s marketing budget of $95.5 million per year is limited relative to other nations such as Australia and Ireland.
This limits the city’s exposure to international tourism marketing and the capacity to position Calgary as a destination for leisure, business, and event travel.
Calgary’s tourism industry also faces issues with rising labor force shortages. As a large sector of Canada’s economy, with 1.8 million employees, Calgary relies on a consistent labor force to manage its hotels, restaurants, and attractions.
Yet, Tourism HR Canada projects a national gap of 60,000 tourism staff by 2035 unless current workforce measures change.
In Calgary, this translates into shorter operating hours, diminished service levels, and a lack of capacity to handle large numbers of tourists.
Overall, these problems reduce Calgary’s return on tourism investment. They restrict international visitor growth, diminish revenues for local businesses, and slow down the city’s capacity to grow its tourism economy in urban and rural areas alike.
| Challenge | Impact on Calgary’s Tourism Sector |
| High travel and flight costs | Discourages multi-destination trips that include Calgary |
| GST on international visitor services | Increases total trip costs for foreign tourists staying in Calgary |
| No rebate for group tour operators | Reduces incentive to bring group travel and business events to the city |
| Underfunded national marketing ($95.5M) | Limits Calgary’s visibility in international tourism markets |
| Labor shortage forecasts (60,000 gap by 2035) | Affects staffing for Calgary’s hospitality and tourism businesses during peak periods |
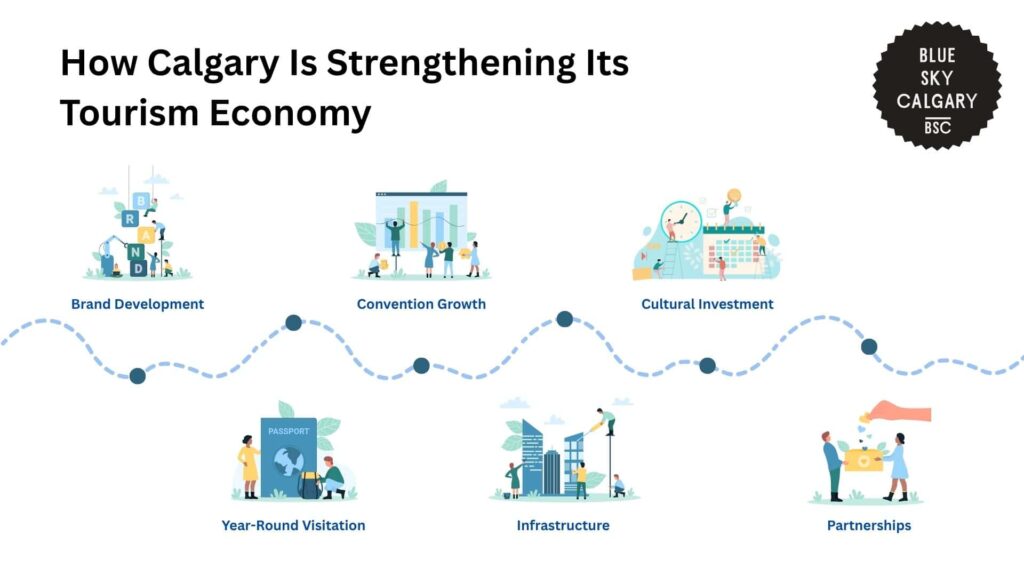
Interventions and Solutions to Weak Tourism Policies in Calgary
The City of Calgary is currently pursuing a multi-faceted strategy to enhance its tourism industry and overcome the policy barriers that restrain growth.
Tourism Calgary’s 2025–2027 Business Plan states that the city is working towards doubling yearly visitor expenditure from $3 billion to $6 billion by 2035.
This objective is being met through continued investments in branding, infrastructure, event programming, and strategic alliances.
A central focus of this initiative is launching a new identity for the city as part of the “Blue Sky City” brand.
The new branding is intended to appeal to a wider group of domestic and global audiences by highlighting Calgary’s cultural richness, vibrant urban landscape, and diverse communities.
Meanwhile, to reduce seasonal dependency, efforts are underway to shift Calgary toward a year-round tourism model.
Currently, more than half of the city’s visitation occurs between May and September. To reverse this, Calgary is reviewing off-season tourism gaps and making investments in programming that promotes winter, early spring, and late fall travel.
This involves assisting local event promoters and adding programming to fill the calendar during historically slower months. The overall goal is to stabilize visitor streams and keep tourism-related businesses open year-round.
Convention facilities are also set to take a key position in tourism planning for Calgary. Through the new BMO Centre expansion, Calgary now has the second-largest convention facility in Canada.
This increased capacity enables the city to compete for larger, higher-value conventions and meetings.
The plan also hopes to lengthen delegate stays by syncing conference calendars with cultural experiences and hospitality services. This helps boost visitor expenditures and connects business tourism with the overall visitor economy.
These initiatives are complemented by major public investment. In 2025 alone, the City of Calgary has provided over $49 million in operating funding to Civic Partners that foster tourism and economic growth.
This includes $4.07 million for Tourism Calgary, $11.7 million for Calgary Economic Development, and further funding for institutions like Fort Calgary, Heritage Park, and TELUS Spark.
The city is also funding significant capital projects such as the Arts Commons Transformation and renovation of the Glenbow Museum to enhance cultural facilities and enhance the visitor experience.
| Initiative | Key Focus |
| Brand Development | Promoting the Blue Sky City branding |
| Year-Round Visitation | Boosting off-peak season visitation |
| Convention Growth | Expanded BMO Centre |
| Infrastructure | Renovating museums and improving visitor experiences |
| Cultural Investment | Bringing in major festivals and events |
| Partnerships | Gaining funding from partners |
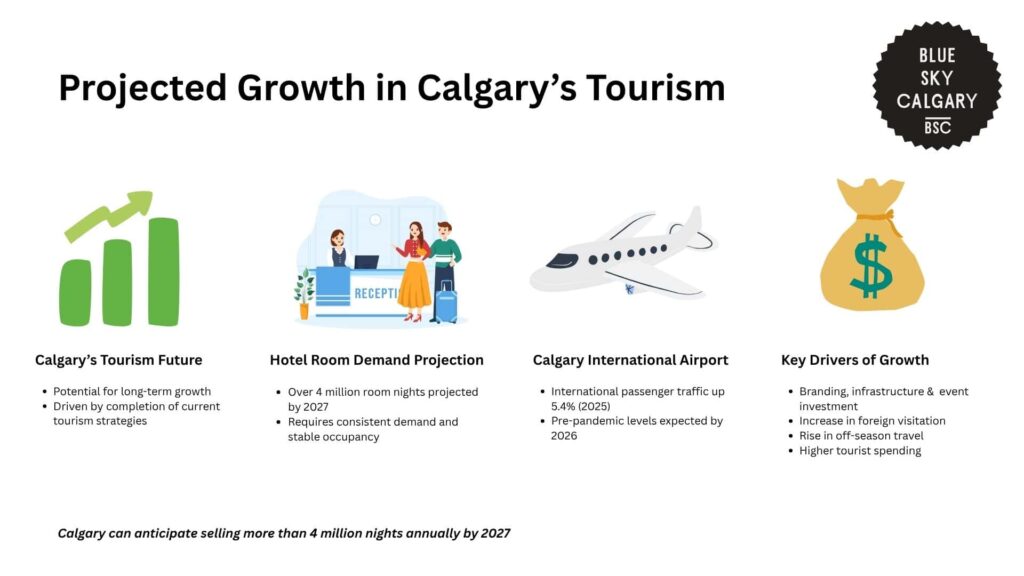
The Future of Tourism in Calgary
If existing strategies are completed, Calgary stands to experience significant long-term tourism activity growth.
Meeting this goal would depend not only on sustained investment in branding, infrastructure, and events but also on increases in foreign visitation, off-season travel, and tourist spending.
Moreover, if room demand continues to rise at a consistent rate while occupancy levels stabilize, Calgary can anticipate selling more than 4 million room nights annually by 2027.
Passenger traffic through Calgary International Airport will also increase. With international traffic up 5.4% year-to-date in 2025 and domestic traffic holding strong, the airport may reach pre-pandemic levels by 2026.
Unless workforce shortages are addressed, however, capacity limitations may restrict the sector’s capacity to meet demand. This highlights the need for workforce development policies to ensure Calgary’s service sector keeps up with visitor growth.
In general, if investment in infrastructure, marketing, and labor continues, Calgary may achieve or even surpass its 2035 tourism goals.
References
- Government of Alberta. (n.d.). Alberta economic dashboard. Open Government. https://open.alberta.ca/publications/2292-9991
- Government of Alberta. (2020). Domestic tourism: Calgary and area tourism region, 2019 (Catalog No. 816a51f3-5692-471b-ac2f-3310b6a42559). Open Government. https://open.alberta.ca/dataset/86405640-1486-4332-ba21-89df5b5dd452/resource/816a51f3-5692-471b-ac2f-3310b6a42559/download/jei-domestic-tourism-cagary-and-area-tourism-region-2019.pdf
- Government of Alberta. (n.d.). Domestic visitor profile: Alberta Central. Open Government. https://open.alberta.ca/publications/domestic-visitor-profile-alberta-central
- Statistics Canada. (n.d.). Travel and tourism. https://www.statcan.gc.ca/en/subjects-start/travel_and_tourism
- Tourism Calgary. (2020). Q4 2019 Destination Report. https://www.visitcalgary.com/sites/default/files/2020-03/FINAL%20-%20Tourism%20Calgary%20-%20Q4%202019%20Destination%20Report.pdf
- Travel Alberta. (n.d.). Economic impact. https://industry.travelalberta.com/research/tourism-indicators/economic-impact
- Calgary International Airport. (2025). Airport statistics. https://www.yyc.com/portals/0/WebsiteStats.pdf
- Calgary International Airport. (n.d.). Facts and figures. https://www.yyc.com/en-us/about-us/facts-figures
- Tourism Industry Association of Canada. (n.d.). The issues. https://tiac-aitc.ca/The_Issues.html
- Government of Canada. (n.d.). Destination Canada: French-speaking and bilingual workers. https://www.canada.ca/en/immigration-refugees-citizenship/services/work-canada/hire-temporary-foreign/french-speaking-bilingual-workers-outside-quebec/destination-canada.html
- Tourism HR Canada. (n.d.). Home. https://tourismhr.ca/
- Tourism Calgary. (n.d.). Destination development: 2025–2027 business plan. https://www.visitcalgary.com/industry-partners/destination-development#:~:text=2025%2D2027%20Business%20Plan,City%3B%20Build%20Community%20and%20Collaboration.
- City of Calgary. (n.d.). Economic development & tourism service plan (2023–2026). https://www.calgary.ca/service-lines/2023-2026-city-services/economic-development-tourism.html?service-line-budget-adjustments-bar-chart-servicelinebudgetadjustments-xview=2023&service-line-budget-bar-chart-serviceplanbudgetasadjustedonnov222023-xview=2023&service-line-budget-bar-chart-serviceplanbudgetasadjustedonnov222023-view-open=