Rising Poverty Rates in Calgary: Statistics and Trend

Key Insights
| Statistics Canada’s Market Basket Measure (MBM) threshold for Calgary in 2024 was at $59,471, up 2.7% from the previous year. Another report by Statistics Canada shows that in 2020, the median income of residents in Calgary after tax was $40,000. The same data shows that in 2020, just a little over 50% of all earning adults in the city had incomes that were above the 2020 MBM threshold of $50,223. Calgary’s 2022 Community Wellbeing Report reveals that 41,890 individuals in the city were classified as “working poor.” Other data from the report also illustrates that in January 2022, a total of 2,622 Calgarians were experiencing homelessness. |
Statistics Canada uses the Market Basket Measure, or MBM, to determine the official poverty threshold in Canadian cities.
This measure is based on the cost of goods and services that a family of two adults and two children needs to maintain a modest but adequate standard of living.
Moreover, the MBM takes into account essential expenses such as food, clothing, shelter, and transportation, all adjusted for the local cost of living in cities like Calgary.
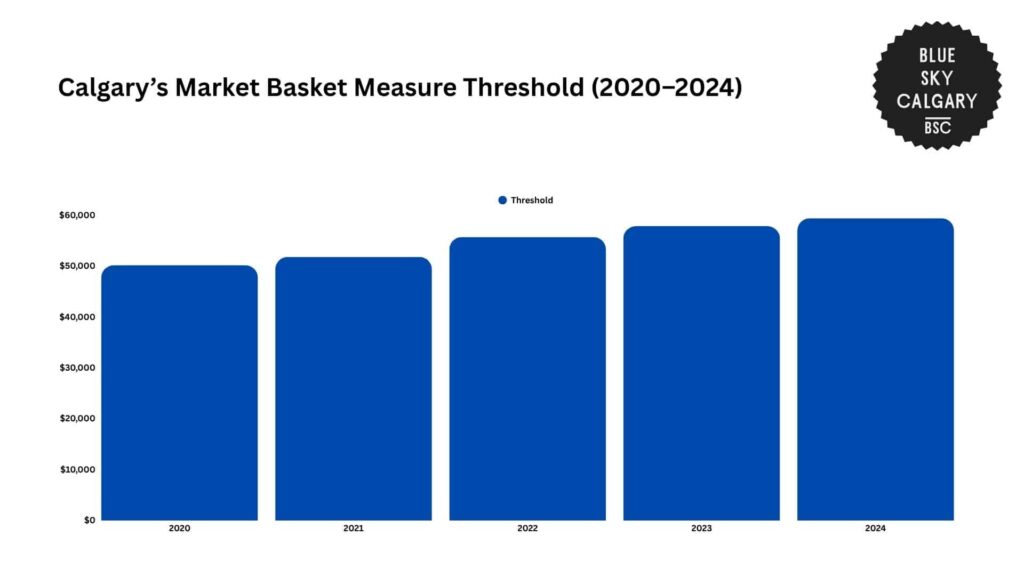
In 2020, the MBM threshold for Calgary was set at $50,223, which means that any family earning less than this amount in disposable income was considered to be living in poverty.
By 2021, the threshold rose to $51,861, representing an increase of $1,638 or 3.3%.
The following year saw a sharper jump. In 2022, the threshold climbed to $55,771, which was $3,910 more than the previous year.
This increase of 7.5% marked the highest single-year rise in the five-year period, which could indicate growing pressure from housing and essential service costs.
In 2023, the MBM threshold continued its upward trend, reaching $57,909. The change from 2022 was $2,138, equivalent to a 3.8% increase.
Although smaller than the previous year, it still pointed to persistent cost-of-living increases across the city.
By 2024, the poverty line had reached $59,471. This latest figure was $1,562 higher than 2023, showing a 2.7% increase.
While the rate of growth slowed, the MBM threshold rose by $9,248, or a total of 18.4%, in a period of 5 years.
| Year | Threshold | Raw Increase from Previous Year | Percentage of Increase from Previous Year |
| 2020 | 50,223.00 | – | – |
| 2021 | 51,861.00 | 1,638.00 | 3.30% |
| 2022 | 55,771.00 | 3,910.00 | 7.50% |
| 2023 | 57,909.00 | 2,138.00 | 3.80% |
| 2024 | 59,471.00 | 1,562.00 | 2.70% |
Average Income Levels in Calgary Compared to Market Basket Measure
Data from Statistics Canada reveals the average income levels of residents in Calgary.
Together with the Market Basket Measure, this shows how residents are affected by income inequality and the rising cost of living in the city.
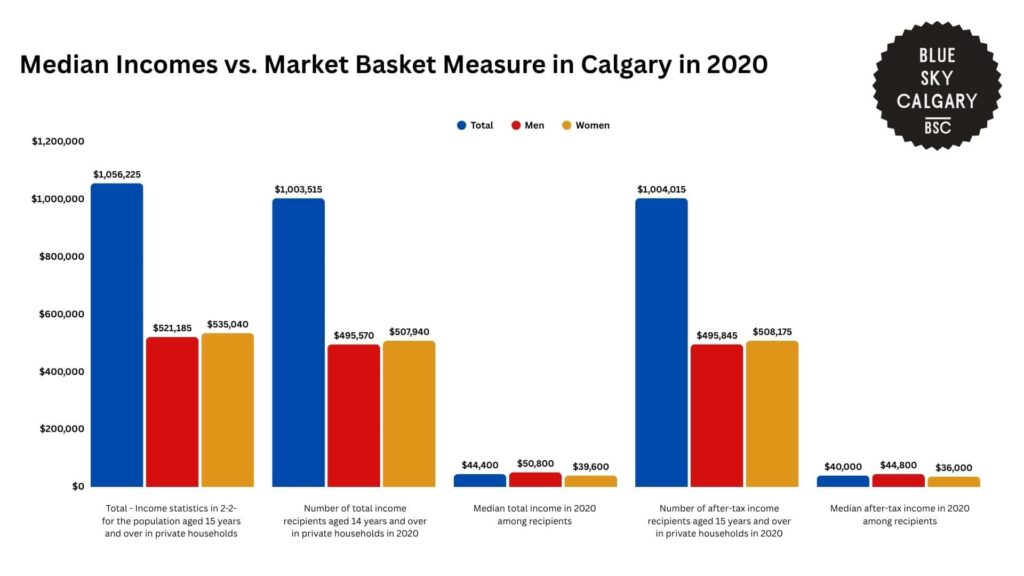
In 2020, Calgary had a total of 1,056,225 individuals aged 15 years and over living in private households.
Of this total population, 1,003,515 individuals reported receiving some form of income, and the median total income across all income recipients was $44,400.
However, there were stark differences when income levels were broken down by gender. Men had a median total income of $50,800, while women reported only $39,600.
This amounts to a difference of $11,200, with men earning 28.3% more than women at the median level.
When considering after-tax income, the results remained unequal. The overall median after-tax income was $40,000, which reflects the take-home income after all government taxes and deductions.
Among men, the median after-tax income was $44,800, compared to just $36,000 among women. This is a gap of $8,800, or 19.6%, indicating that gender-based disparities persist.
When compared to Calgary’s Market Basket Measure (MBM) for 2020, which was $50,223, both men’s and women’s median after-tax incomes fell below the threshold.
Even the citywide median of $40,000 was well below the minimum income needed to afford a modest standard of living.
This suggests that a majority of adults in Calgary would not meet the MBM standard unless they were part of a dual-income household or receiving supplementary support.
| Characteristics | Total | Men | Women |
| Total – Income statistics in 2-2- for the population aged 15 years and over in private households | 1,056,225.00 | 521,185.00 | 535,040.00 |
| Number of total income recipients aged 14 years and over in private households in 2020 | 1,003,515.00 | 495,570.00 | 507,940 |
| Median total income in 2020 among recipients | 44,400.00 | 50,800.00 | 39,600 |
| Number of after-tax income recipients aged 15 years and over in private households in 2020 | 1,004,015.00 | 495,845.00 | 508,175 |
| Median after-tax income in 2020 among recipients | 40,000.00 | 44,800.00 | 36,000 |
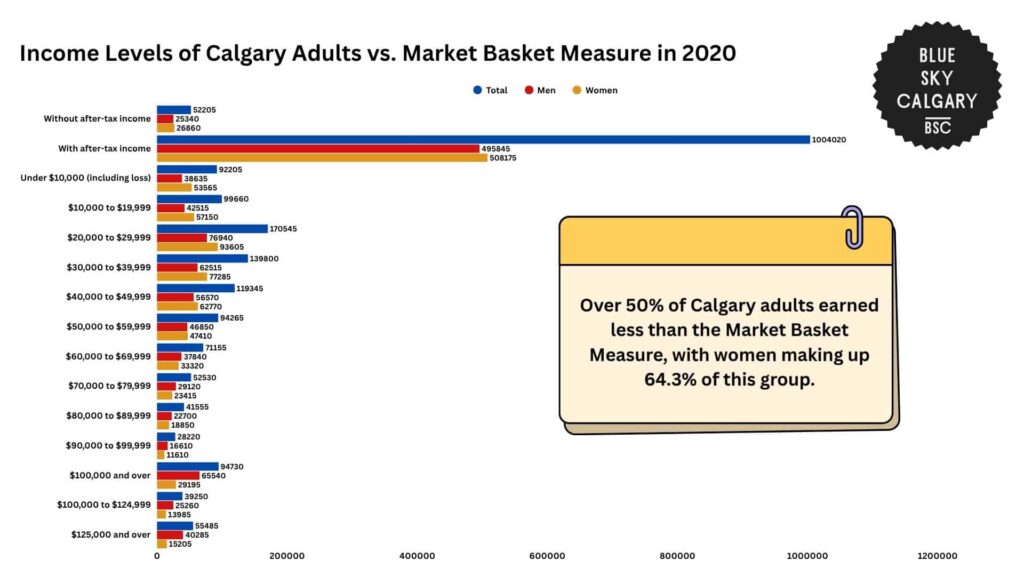
The wider breakdown of income groups in Calgary shows how many people were living with limited financial resources in 2020.
Out of 1,056,220 adults aged 15 and over, 52,205 people had no after-tax income. This group included 25,340 men and 26,860 women.
These individuals may have relied on government support, informal work, or had no income source at all.
In the under $10,000 group, there were 92,205 people, with 38,635 men and 53,565 women. At this level of income, it would be very difficult to afford even basic needs without support.
Next, the $10,000 to $19,999 range had 99,660 people, including 42,515 men and 57,140 women. Women again made up the majority, at around 57.3%.
While this is slightly better than the previous bracket, it is still far below the $50,223 poverty line set by the Market Basket Measure (MBM) in 2020. Most people in this range likely struggled with housing, transportation, or healthcare costs.
In the $20,000 to $29,999 group, there were 170,545 people, with 76,940 men and 93,605 women.
This was the largest single income group in the city and made up 16.1% of the adult population. Although this income is closer to the MBM poverty line, it’s still not enough to live comfortably.
Close to this, the $30,000 to $39,999 group made up 139,800 people, with 62,715 men and 77,085 women. Most people here are likely able to afford basic needs but may have only a little left over for savings or emergencies.
In the $40,000 to $49,999 group, there were 119,345 people, including 56,570 men and 62,770 women. This group came closest to the poverty line but still remained below it.
Altogether, about 532,615 people earned less than the $50,223 MBM threshold in 2020, which is just over 50% of all earning adults in Calgary.
Among them, 344,165 were women, while 256,360 were men. This means that 64.3% of women earned below the poverty line, compared to 49.2% of men.
The remaining portion, those earning above $50,223, represented roughly 47% of adults.
These individuals had higher levels of financial stability and were more likely to afford regular expenses such as rent, groceries, and transportation without relying on assistance.
Among those earning above the threshold, men made up a clear majority, especially in the highest brackets.
For instance, in the $100,000 and over group, 65,640 were men compared to 29,155 women.
These upper-income groups often had access to more secure jobs, benefits, and opportunities for savings or investment.
However, while they were less exposed to the risks of poverty, they still faced rising living costs.
| Income Groups | Total | Men | Women |
| Without after-tax income | 52,205.00 | 25,340.00 | 26,860.00 |
| With after-tax income | 1,004,020.00 | 495,845.00 | 508,175.00 |
| Under $10,000 (including loss) | 92,205 | 38,635 | 53,565 |
| $10,000 to $19,999 | 99,660 | 42,515 | 57,150 |
| $20,000 to $29,999 | 170,545 | 76,940 | 93,605 |
| $30,000 to $39,999 | 139,800 | 62,515 | 77,285 |
| $40,000 to $49,999 | 119,345 | 56,570 | 62,770 |
| $50,000 to $59,999 | 94,265 | 46,850 | 47,410 |
| $60,000 to $69,999 | 71,155 | 37,840 | 33,320 |
| $70,000 to $79,999 | 52,530 | 29,120 | 23,415 |
| $80,000 to $89,999 | 41,555 | 22,700 | 18,850 |
| $90,000 to $99,999 | 28,220 | 16,610 | 11,610 |
| $100,000 and over | 94,730 | 65,540 | 29,195 |
| $100,000 to $124,999 | 39,250 | 25,260 | 13,985 |
| $125,000 and over | 55,485 | 40,285 | 15,205 |
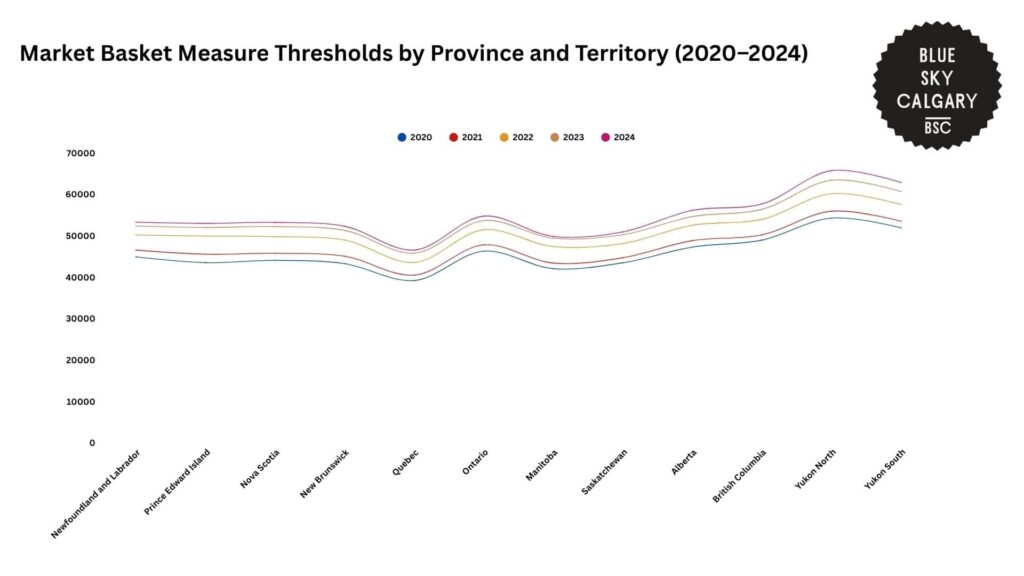
Regional Analysis of Market Basket Measure Threshold Across Canadian Provinces
The Market Basket Measure illustrates how the cost of living varies across different provinces in Canada.
In Alberta, the MBM rose from $47,280 in 2020 to $56,150 in 2024, reflecting an 18.8% increase over five years. This trend places Alberta among the higher-cost provinces in the country.
Close to this, British Columbia saw its MBM increase from $48,964 to $57,698 over the same period, marking a rise of $8,734 or 17.8%.
This threshold was $1,548 higher than Alberta’s, showing that the cost of living in cities in British Columbia outpaces that of Alberta.
In Ontario, the MBM went from $46,306 in 2020 to $54,755 in 2024, which is an overall increase of $8,449 or 18.2%.
Although the rate of growth was comparable to Alberta, Ontario’s MBM remained $1,395 lower, which implies that they have slightly lower basic living costs across the province.
Quebec had the lowest MBM among all provinces in 2024 at $46,567, up from $39,202 in 2020. Despite an 18.8% rise, the final figure was $9,583 below Alberta’s, pointing to more affordable essentials such as rent and food in many parts of the province.
For Manitoba, their MBM reached $49,844 in 2024, rising by $7,777 from 2020. That made their threshold $6,306 lower than Alberta’s.
In Saskatchewan, the MBM rose from $43,489 to $50,947, a growth of $7,458 or 17.1%, which is one of the slowest rates. This left the 2024 figure $5,203 less than Alberta’s, reflecting slower rises in the cost of living.
Nova Scotia experienced a sharper climb, with the MBM rising from $44,076 to $53,241, an increase of $9,165 or 20.8%.
Despite the fast growth, its 2024 figure remained $2,909 below Alberta’s, showing that while living costs are rising quickly, they still lag behind Alberta’s rate.
Finally, Yukon North and South had the highest MBM rates at $65,731 and $62,86, respectively.
| Province | 2020 | 2021 | 2022 | 2023 | 2024 |
| Newfoundland and Labrador | 44,911 | 46,549 | 50,238 | 52,388 | 53,301 |
| Prince Edward Island | 43,517 | 45,564 | 49,939 | 52,020 | 53,016 |
| Nova Scotia | 44,076 | 45,781 | 49,800 | 52,244 | 53,241 |
| New Brunswick | 43,282 | 45,081 | 48,975 | 51,313 | 52,311 |
| Quebec | 39,202 | 40,505 | 43,566 | 45,821 | 46,567 |
| Ontario | 46,306 | 47,813 | 51,468 | 53,678 | 54,755 |
| Manitoba | 42,067 | 43,423 | 47,395 | 49,419 | 49,844 |
| Saskatchewan | 43,489 | 44,713 | 48,139 | 50,262 | 50,947 |
| Alberta | 47,280 | 48,831 | 52,555 | 54,657 | 56,150 |
| British Columbia | 48,964 | 50,237 | 53,980 | 56,397 | 57,698 |
| Yukon North | 54,296 | 55,953 | 60,185 | 63,430 | 65,731 |
| Yukon South | 51,939 | 53,522 | 57,572 | 60,681 | 62,886 |
Poverty Trends in Calgary
According to Calgary’s 2022 Community Wellbeing Report, the city remains the second most unequal city in Canada, following Toronto.
The report also shows that many residents in the city are living in a state of survival, as they are unable to keep up with rising prices despite working or receiving aid.
Calgary’s “working poor” remains a significant portion of the population. As of the latest data, 41,890 individuals were classified as working poor, meaning they were employed but still lived below the poverty line.
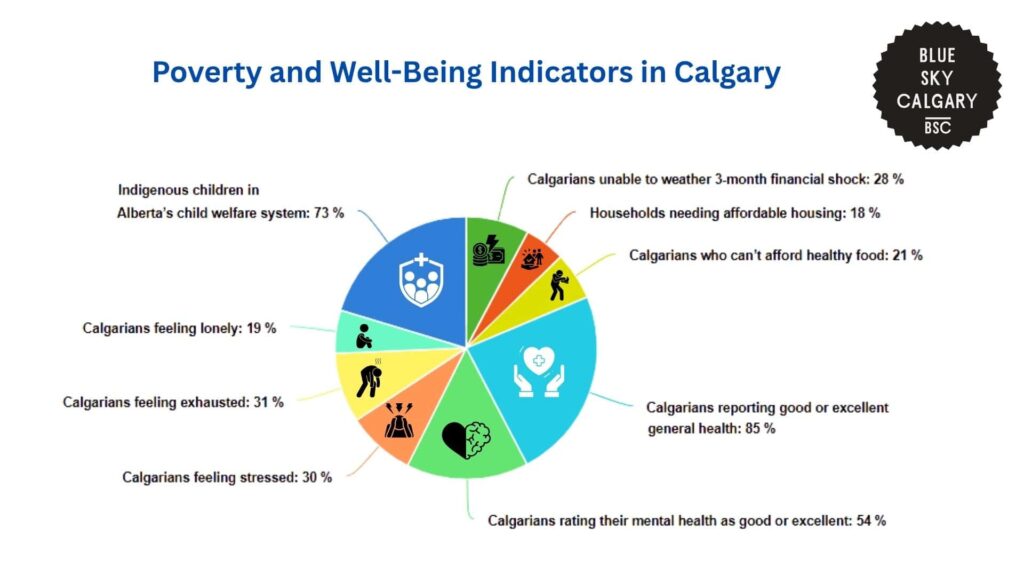
Financial insecurity extends beyond employment issues. 28% of Calgarians could not withstand a financial shock lasting three months, and those with the lowest incomes are least likely to save for the future.
The housing crisis is another key issue in Calgary. As of January 2022, 2,622 Calgarians were experiencing homelessness.
In addition, 81,240 households, or 18% of the city, were in need of affordable housing. This is because rising rent costs have made both home ownership and rental options less accessible for many.
Food security is also an ongoing issue. 12% of households in Calgary experience marginal, moderate, or severe food insecurity, and 21% of residents cannot afford healthy food.
With food prices rising, many households face difficult choices between nutrition and other essentials.
Health and well-being indicators show a mixed picture. 85% of Calgarians rated their general health as excellent or very good, though only 54% said the same for their mental health.
Along with this, 30% felt stressed, 31% felt exhausted, and 19% felt lonely, which reveals how emotional and psychological pressures are linked to financial strains.
Finally, indigenous communities in Calgary continue to face distinct challenges. The Indigenous population grew by 17% over the past seven years, and 73% of children in Alberta’s child welfare system are Indigenous.
This shows that these indigenous communities are disproportionately affected by all of these economic challenges.
Overall, these statistics give an overview of how poverty affects different groups in the province and highlight which issues are the most pressing.
| Poverty Indicators | Percentage or Number of the Population |
| Individuals classified as working poor | 41,980 |
| Calgarians unable to weather 3-month financial shock | 28% |
| Households needing affordable housing | 81,240 or 18% of the total population |
| Households experiencing food insecurity | |
| Calgarians experiencing homelessness | 2,622 |
| Calgarians who can’t afford healthy food | 21% |
| Calgarians reporting good or excellent general health | 85% |
| Calgarians rating their mental health as good or excellent | 54% |
| Calgarians feeling stressed | 30% |
| Calgarians feeling exhausted | 31% |
| Calgarians feeling lonely | 19% |
| Indigenous children in Alberta’s child welfare system | 73% |
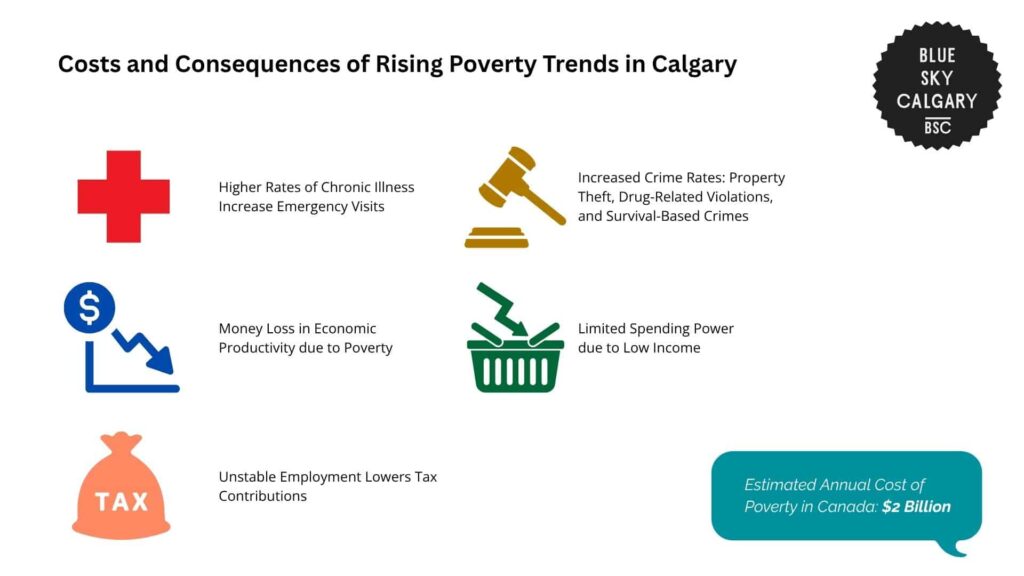
Costs and Consequences of Increasing Income Inequality
According to a 2021 report by the Canadian Centre for Policy Alternatives, poverty costs the country approximately $2 billion each year.
This estimate includes a wide range of economic consequences, such as increased public healthcare spending, greater demand on the justice system, and reduced overall productivity.
While poverty is often discussed in social terms, its financial impact on public budgets and economic performance is also substantial.
One of the largest cost drivers is the strain placed on the healthcare system.
People living in poverty are more likely to experience chronic illnesses and mental health challenges, often due to stress, poor living conditions, and lack of preventive care.
When individuals cannot access nutritious food, stable housing, or regular medical check-ups, they tend to require more emergency services and long-term treatment.
This leads to higher use of hospitals, clinics, and community health resources, which increases overall spending by the province.
Justice system expenses are another significant component.
The research shows a clear connection between poverty and increased rates of crime, particularly non-violent offenses such as property theft, drug-related violations, and survival-based crimes.
Economic hardship can lead individuals to engage in illegal activity when stable income and housing are out of reach.
As a result, the province bears higher costs related to policing, legal proceedings, correctional facilities, and rehabilitation programs.
The province also loses money in economic productivity due to poverty. Many individuals in low-income households face obstacles that prevent them from entering or remaining in the workforce.
These barriers can include a lack of childcare services, unreliable transportation, untreated health issues, and unstable housing.
In addition, low-income individuals often have limited spending power, which directly affects the broader economy.
When people are forced to cut back on goods and services due to financial strain, consumer demand drops.
This not only impacts business revenues but also reduces tax income used to fund public services like education, infrastructure, and health care.
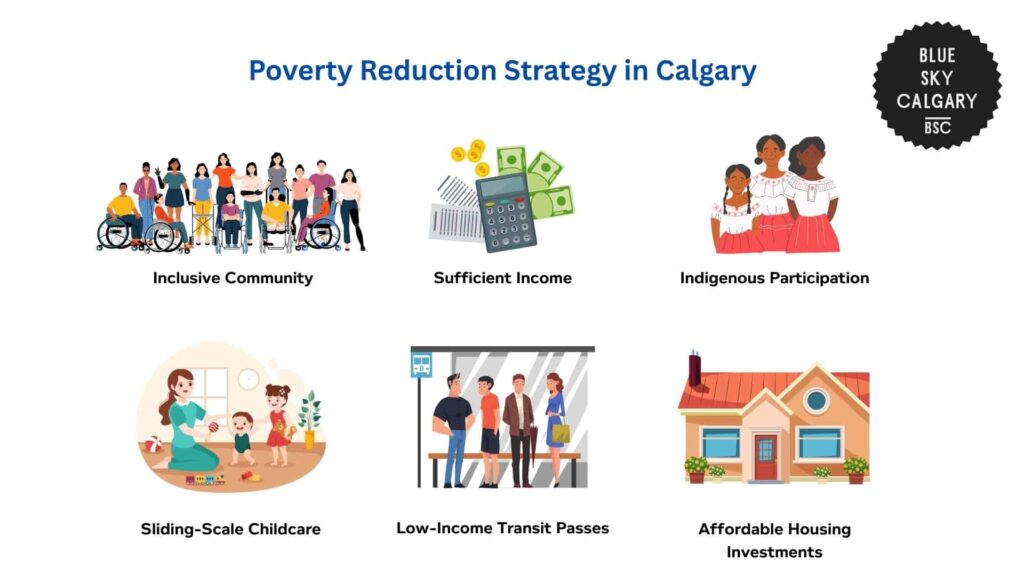
Interventions and Solutions to Poverty in Calgary
Calgary’s citywide poverty reduction strategy, Enough for All, approaches long-term change through coordinated, community-driven action.
At its core are ten Levers of Change, which are specific focus areas that were shaped through local consultations and research on successful anti-poverty efforts across Canada.
These are not applied uniformly and are instead designed to respond to the unique needs of diverse populations, including Indigenous peoples, newcomers, seniors, youth, LGBTQ2S+ individuals, and others who face systemic barriers.
Their strategy is then guided by three primary goals: building a strong and inclusive community, ensuring that all Calgarians have the income and assets they need to thrive, and advancing Indigenous inclusion and leadership in Calgary’s future.
These broad goals are further supported by ten strategic focus areas that guide both policy and service delivery.
Among these are adult literacy, early learning and care, employment access, and financial empowerment.
A wide range of community interventions supports this framework. Programs such as sliding-scale childcare, low-income transit passes, and affordable housing investments help reduce immediate pressure on households.
At the same time, initiatives focused on foundational learning, workforce training, and financial literacy build the skills and supports needed to exit poverty in the long term.
By combining short-term assistance with long-term planning, the strategy takes a holistic approach to breaking the cycle of poverty.
Since its early beginnings in 2005, it has evolved into a shared commitment among several local partners.
Its adoption by Calgary City Council and the United Way of Calgary and Area in 2013, followed by joint stewardship with Vibrant Communities Calgary, Momentum, and other community organizations, has made it a deeply rooted, multi-sector initiative.
These partnerships ensure that poverty reduction efforts are not just reactive, but coordinated, resourced, and embedded in the city’s long-term planning.
The Future of Poverty in Calgary
Based on current trends in income, housing, and cost of living, Calgary is likely to face continued pressure across key areas affecting poverty and inequality.
If the Market Basket Measure continues to rise at a pace similar to the past five years, Calgary’s poverty threshold could exceed $65,000 by 2027, placing more families at risk.
Without substantial wage growth, more individuals who were previously considered middle-income may begin to experience economic insecurity.
Housing affordability will also likely remain a significant challenge.
With 18% of households already needing affordable housing, and rents continuing to outpace income growth, the number of Calgarians facing housing issues may increase.
This could also drive up homelessness, particularly among vulnerable groups like Indigenous peoples and low-wage workers.
On the other hand, sustained investment in Calgary’s Enough for All strategy could reverse some of these trends.
Continued focus on employment, affordable housing, and financial empowerment could improve economic stability over time.
If current initiatives are supported further, poverty rates may stabilize or even decline in the coming decade.

References
- CityNews. (2023, December 10). Calgary poverty line second highest in Canada after Toronto: Report. https://calgary.citynews.ca/2023/12/10/calgary-poverty-line-toronto-vancouver/
- Statistics Canada. (n.d.). Table 11-10-0066-01: Market Basket Measure (MBM) thresholds for the reference family by Market Basket Measure region, component and base year. https://www150.statcan.gc.ca/t1/tbl1/en/tv.action?pid=1110006601
- Statistics Canada. (2021). Census profile, 2021 Census of Population, Calgary [Census subdivision], Alberta. https://www12.statcan.gc.ca/census-recensement/2021/dp-pd/prof/details/page.cfm?Lang=E&GENDERlist=1,2,3&STATISTIClist=1&HEADERlist=0&DGUIDlist=2021A00054806016&SearchText=calgary
- Enough for All. (n.d.). Calgary’s community wellbeing report. https://wellbeing.enoughforall.ca/
- Enough for All. (n.d.). 2021 Ward 1 poverty profile. https://enoughforall.ca/poverty-profiles-2021-ward-1
- City of Calgary. (n.d.). Calgary population profile. https://www.calgary.ca/research/population-profile.html
- Canadian Centre for Policy Alternatives. (2021, April). The cost of poverty in the Atlantic provinces. https://policyalternatives.ca/sites/default/files/uploads/publications/Nova%20Scotia%20Office/2021/04/CostofpovertyinAtlanticprovincesCCPA.pdf
- Enough for All. (n.d.). About the strategy. https://enoughforall.ca/about