Understanding Calgary’s Accident Statistics: Traffic and Workplace Trends

Key Insights
| Open Alberta reveals that between 2019 and 2023, the total number of traffic collisions in Alberta decreased from 132,074 to 119,070. Data from WBC Alberta in 2023 illustrates that the three leading occupations for injury claims are nursing aides, orderlies, patient service associates, material handlers, and retail salespersons. The same report also shows that in 2023, the highest number of claims were from nurse aides, orderlies, and patient service associates, at 6% of the total. According to Statistics Canada in 2023, Alberta reported 6.4 traffic accident fatalities and 379.9 injuries per 100,000 population. Calgary’s 2020 Traffic Collision Summary reports that between 2019 and 2020, the total number of intersection collisions in the city dropped by 39%. |
Traffic and workplace accidents continue to affect thousands of Calgary residents each year. These incidents range from collisions on city roads to physical injuries in the workplace.
Recent data reveals how the frequency and severity of these different types of accidents have shifted over time, and how these affect residents.
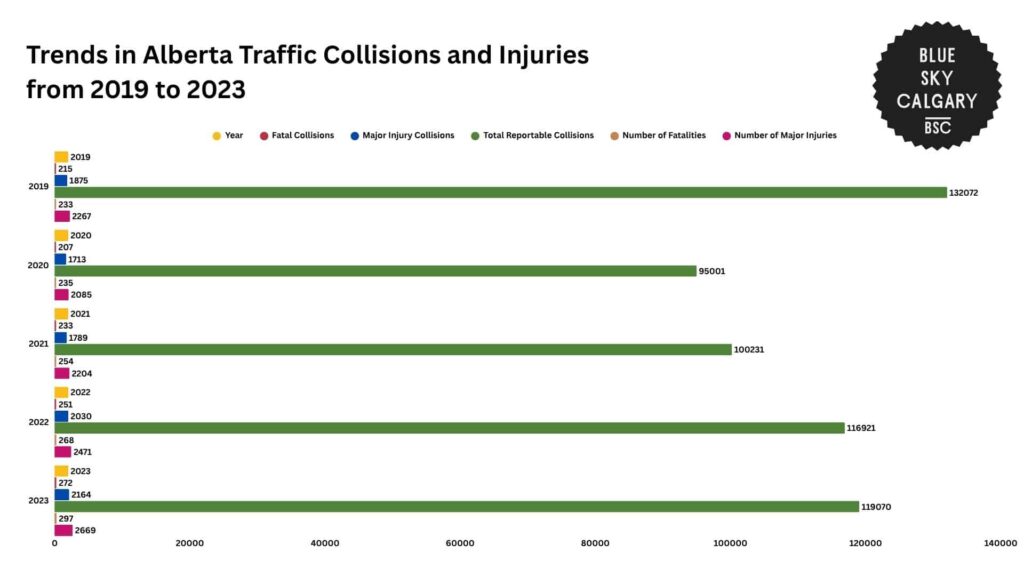
Information from Open Alberta shows that traffic collisions in Alberta have fluctuated significantly between 2019 and 2023, with notable changes in both volume and severity.
In 2019, the province recorded 132,072 reportable traffic collisions. That year also saw 215 fatal collisions, 1,875 major injury collisions, 233 fatalities, and 2,267 major injuries.
This was the highest total collision count within the five-year period, and the following years experienced considerable declines with fluctuations in these numbers.
By 2020, the total number of reported collisions dropped sharply to 95,001, which is a 28.1% decrease from the previous year. This decline coincided with the COVID-19 pandemic, which likely reduced road usage.
However, despite fewer incidents overall, there were still 207 fatal collisions and 1,713 major injury collisions. The number of fatalities was 235, slightly higher than in 2019, while major injuries fell to 2,085.
A slight rise occurred in 2021, with total reportable collisions increasing to 100,231. Fatal collisions also rose to 233, while major injury collisions reached 1,789.
Meanwhile, the number of fatalities climbed to 254, and major injuries increased to 2,204. These figures suggest that as road activity resumed, the severity of crashes continued to worsen.
In 2022, collisions rose further to 116,921, which is up 16.6% from the year before. Fatal collisions reached 251, and major injury collisions jumped to 2,030.
From this number, there were 268 fatalities and 2,471 major injuries reported that year. A consistent rise in both fatal and injury metrics shows a troubling trend in crash outcomes.
By 2023, Alberta saw 119,070 reported collisions. This marked a 1.8% increase from 2022, although this is still 9.8% lower than the 2019 total.
Notably, fatal collisions hit 272, which is the highest in five years, while major injury collisions rose to 2,164. With this, the number of fatalities reached 297, up 10.8% from the year before, and major injuries climbed to 2,669.
Increases for this year point to a steady rise in crash severity despite only modest growth in total collision numbers.
Overall, the data show that while the total number of collisions has not returned to pre-pandemic numbers, the consequences of those collisions have become more severe.
| Year | Fatal Collisions | Major Injury Collisions | Total Reportable Collisions | Number of Fatalities | Number of Major Injuries |
| 2023 | 272 | 2,164 | 119,070.00 | 297.00 | 2,669.00 |
| 2022 | 251 | 2,030 | 116,921 | 268.00 | 2,471.00 |
| 2021 | 233 | 1,789 | 100,231 | 254.00 | 2,204 |
| 2020 | 207 | 1,713 | 95,001 | 235 | 2,085 |
| 2019 | 215 | 1,875 | 132,072 | 233.00 | 2,267 |
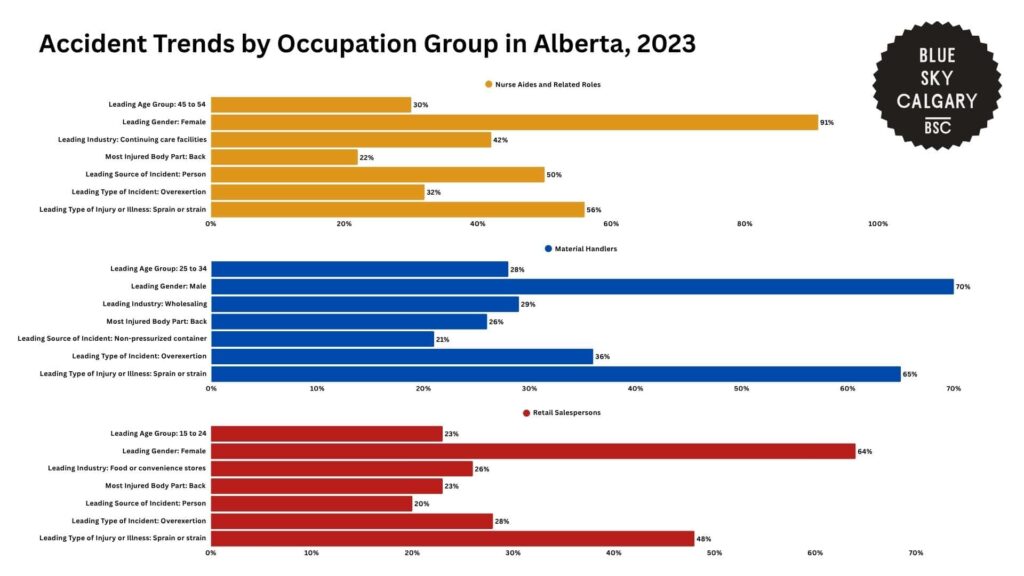
Data from WCB Alberta highlights the injury profiles of workers across various occupations in 2023.
The leading occupation groups for claims are nurse aides, orderlies, patient service associates, material handlers, and retail salespersons.
Among nurse aides, orderlies, and patient service associates, the most common age group with injury claims was 45 to 54, accounting for 30% of cases.
This group was predominantly female at 91%, and most were employed in continuing care facilities, which represented 42% of the total. The most frequently injured body part was the back, reported in 22% of cases.
Meanwhile, the leading source of injury was interaction with a person, which accounted for 50% of incidents. Overexertion also caused 32% of all injuries, and the most common type of injury was sprain or strain, making up 56% of all claims.
Injuries from material handlers were generally younger, with the 25 to 34 age group making up 28% of the claims. Most were male at 70%, and the leading industry was wholesaling, which made up 29% of this group.
The back was again the most commonly injured body part, recorded in 26% of cases. Most injuries in this group were caused by contact with non-pressurized containers, making up 21% of claims.
Here, overexertion was also the leading type of incident at 36%, and sprains or strains were reported in 65% of all cases, the highest among the three groups.
Retail salespersons had the youngest profile, with the leading age group being 15 to 24, accounting for 23% of claims.
A majority of claimants were female at 64%, and the most common industry was food or convenience stores, where 26% were employed. Back injuries were the most frequent again, reported in 23% of cases.
The primary source of injury was contact with a person, which made up 20% of cases. Overexertion once again accounted for 28% of injuries, while sprains or strains made up 48% of all reported cases.
Across all three occupation groups, the most injured body part was the back, while the leading type of incident was overexertion and sprain or strain.
| Category | Nurse Aides and Related Roles | Material Handlers | Retail Salespersons |
| Leading Age Group | 45 to 54 (30%) | 25 to 34 (28%) | 15 to 24 (23%) |
| Leading Gender | Female (91%) | Male (70%) | Female (64%) |
| Leading Industry | Continuing care facilities (42%) | Wholesaling (29%) | Food or convenience stores (26%) |
| Most Injured Body Part | Back (22%) | Back (26%) | Back (23%) |
| Leading Source of Incident | Person (50%) | Non-pressurized container (21%) | Person (20%) |
| Leading Type of Incident | Overexertion (32%) | Overexertion (36%) | Overexertion (28%) |
| Leading Type of Injury or Illness | Sprain or strain (56%) | Sprain or strain (65%) | Sprain or strain (48%) |
Regional Analysis of Accident Trends Across Canadian Provinces
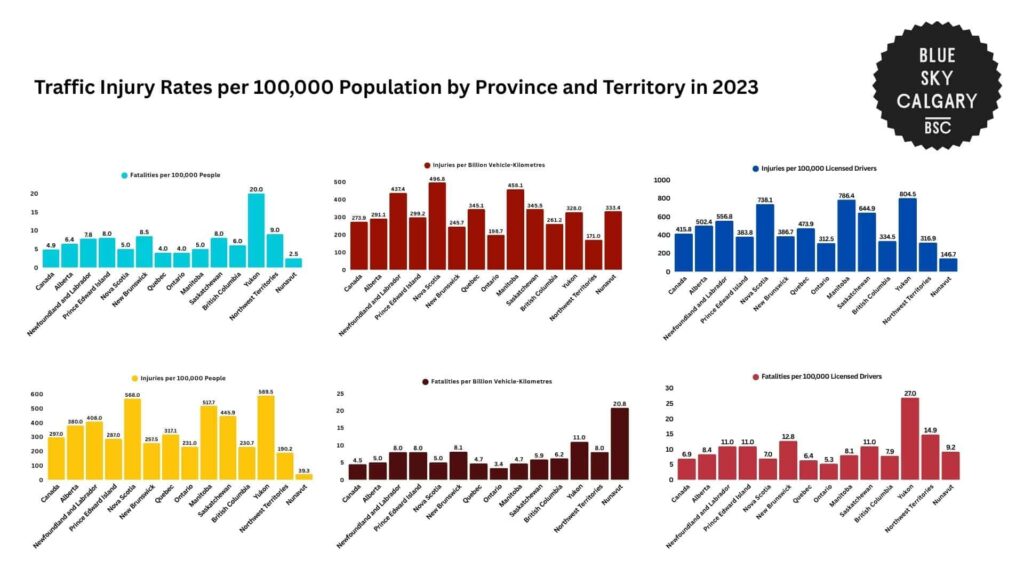
Statistics Canada shows that in Alberta in 2023, traffic accident rates had a consistent trend of being above national averages.
The province reported 6.4 fatalities and 379.9 injuries per 100,000 population. Compared to the national averages of 4.9 fatalities and 296.5 injuries, this places Alberta 30.6% higher in fatality rate and 28.1% higher in injury rate per population.
When adjusted per billion vehicle-kilometres traveled, Alberta recorded 4.9 fatalities and 291.1 injuries. These values again exceed the Canadian average of 4.5 fatalities and 273.9 injuries.
Alberta’s injury rate by travel volume is also 6.3% higher than the national rate, indicating more frequent injuries relative to road usage.
Per 100,000 licensed drivers, Alberta reported 8.4 fatalities and 502.4 injuries. This is significantly higher than Canada’s average of 6.9 fatalities and 415.8 injuries.
Alberta exceeds the national average by 21.7% in driver-related fatalities and by 20.8% in injuries.
Newfoundland and Labrador also had elevated rates, with 7.8 fatalities and 408.2 injuries per 100,000 people.
Its injury rate per 100,000 drivers reached 556.8, which is 10.8% higher than Alberta’s. Furthermore, its fatality rate per licensed driver was 10.6, still above Alberta’s 8.4.
In Prince Edward Island, the fatality rate per 100,000 population was 8.1, and the injury rate was 287.3.
While its injury rate was below Alberta’s, its fatalities per billion vehicle-kilometres stood at 8.4, 71.4% higher than Alberta’s 4.9. Prince Edward Island’s fatality rate per driver was 10.8, again higher than Alberta’s.
Nova Scotia showed a contrasting picture. Its fatality rate per 100,000 population was 5.3, lower than Alberta’s, but its injury rate was 567.6, the highest in the country, and 49.3% above Alberta’s.
Per licensed driver, Nova Scotia reported 738.1 injuries, a full 47% higher than Alberta’s rate.
Manitoba followed a similar pattern. While its fatality rate per population was comparable to Alberta’s at 5.4, its injury rate reached 517.7, which is 36.3% higher than Alberta’s 379.9.
It also had the highest driver-based injury rate among the provinces at 786.4, outpacing Alberta by 56.5%.
Saskatchewan recorded 7.6 fatalities and 445.9 injuries per 100,000 people. Injury and fatality rates for drivers stood at 644.9 and 11.0, respectively, both above Alberta’s by over 28%.
British Columbia, in contrast, reported lower rates across the board. Fatalities per 100,000 people were 5.5, and injuries were 230.7, placing it well below Alberta’s figures.
Ontario had some of the lowest figures. It reported just 3.9 fatalities and 231.0 injuries per 100,000 people. Its fatality rate per billion vehicle-kilometres was 3.4, compared to Alberta’s 4.9.
The three territories showed much more extreme values. Yukon had the highest fatality rate at 19.8 per 100,000 people and 27.0 per 100,000 drivers. Injuries per driver reached 804.5, 60.1% higher than in Alberta.
The Northwest Territories followed with a fatality rate of 9.0 per 100,000 population and 14.9 per 100,000 drivers.
Nunavut, although having a low injury rate of 39.3 per population, recorded the highest fatality rate per vehicle-kilometre at 20.8.
| Province/Territory | Fatalities per 100,000 People | Injuries per 100,000 People | Fatalities per Billion Vehicle-Kilometres | Injuries per Billion Vehicle-Kilometres | Fatalities per 100,000 Licensed Drivers | Injuries per 100,000 Licensed Drivers |
| Canada | 4.9 | 297 | 4.50 | 273.90 | 6.90 | 415.80 |
| Alberta | 6.4 | 380 | 5 | 291.10 | 8.40 | 502.40 |
| Newfoundland and Labrador | 7.8 | 408 | 8 | 437.40 | 11 | 556.8 |
| Prince Edward Island | 8 | 287 | 8 | 299.2 | 11 | 383.80 |
| Nova Scotia | 5 | 568 | 5 | 496.80 | 7 | 738.1 |
| New Brunswick | 8.5 | 257.5 | 8.10 | 245.70 | 12.8 | 386.7 |
| Quebec | 4 | 317.1 | 4.70 | 345.10 | 6.4 | 473.9 |
| Ontario | 4 | 231 | 3.40 | 198.70 | 5.30 | 312.50 |
| Manitoba | 5 | 517.7 | 4.70 | 458.10 | 8.10 | 786.40 |
| Saskatchewan | 8 | 445.9 | 5.90 | 345.50 | 11.00 | 644.90 |
| British Columbia | 6 | 230.70 | 6.20 | 261.20 | 7.90 | 334.50 |
| Yukon | 20 | 589.50 | 11.00 | 328.00 | 27.00 | 804.50 |
| Northwest Territories | 9 | 190.20 | 8.00 | 171.00 | 14.90 | 316.90 |
| Nunavut | 2.5 | 39.3 | 20.8 | 333.4 | 9.2 | 146.7 |
Accident Trends in Calgary
Traffic Accident Trends
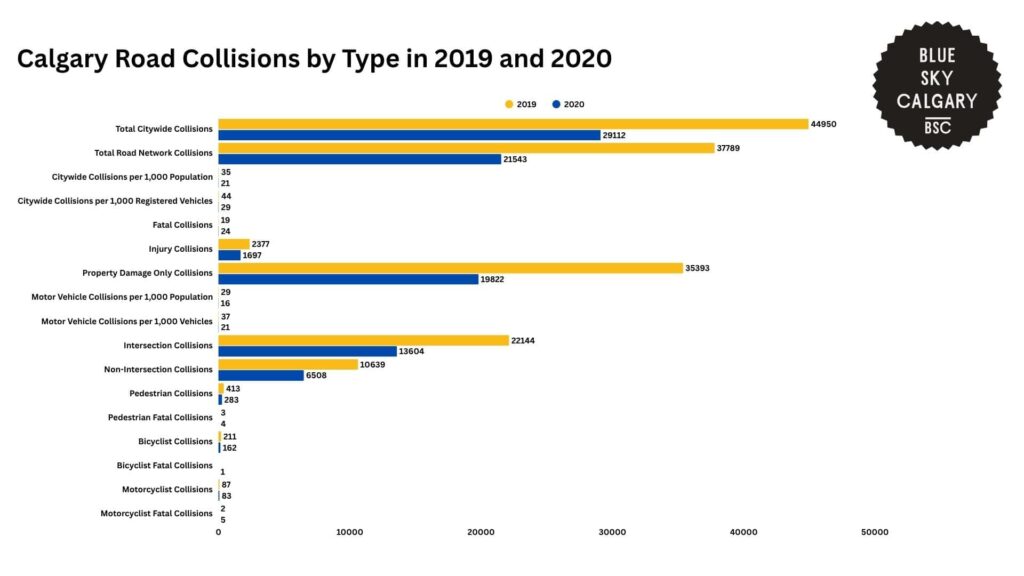
The 2020 Traffic Collision Summary for Calgary shows major declines across most accident categories in the city.
In 2019, Calgary recorded 44,950 total citywide collisions. By 2020, that number dropped to 29,112, reflecting a 35% decrease.
Road network collisions also declined by 43%, falling from 37,789 to 21,543. This downward trend was also seen in per capita rates, with citywide collisions per 1,000 population falling from 35 to 21.
When measured per 1,000 registered vehicles, the citywide collision rate decreased from 44 to 29, which is a 34% drop.
Fatal collisions, however, rose from 19 in 2019 to 24 in 2020, representing a 26% increase.
Injury collisions declined by 29%, from 2,377 to 1,697. Property damage only collisions saw the largest decline in volume, falling 44% from 35,393 to 19,822.
Motor vehicle collisions per capita decreased significantly by 45%, from 29 to 16 per 1,000 population. The rate per 1,000 registered vehicles also fell from 37 to 21, a 43% reduction.
Similarly, intersection collisions dropped from 22,144 in 2019 to 13,604 in 2020, a 39% decline. Non-intersection collisions showed a similar pattern, decreasing from 10,639 to 6,508, also down by 39%.
Pedestrian collisions also fell by 31%, from 413 to 283. The number of pedestrian fatalities increased slightly from 3 to 4, a 33% rise, while pedestrian injury collisions dropped from 323 to 229.
This resulted in a 34% decline in the pedestrian collision rate per 100,000 population, moving from 32 to 21.
Bicyclist collisions decreased by 23%, from 211 to 162. There was one bicyclist fatality in 2020, compared to none in 2019.
Motorcyclist collisions declined slightly by 5%, from 87 to 83. Fatal collisions involving motorcyclists increased from 2 to 5, a 150% jump, while injury collisions dropped only slightly from 47 to 45.
Although most categories saw a decrease in volume, the rise in fatal collisions, especially involving motorcyclists and pedestrians, raises concerns about road safety under lower traffic conditions.
Workplace Accident Trends
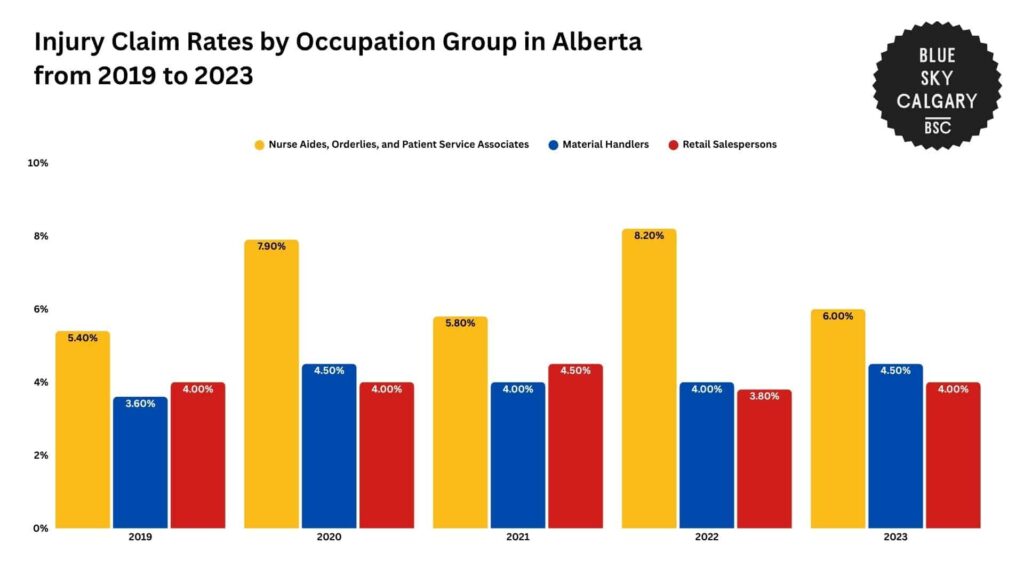
Open Alberta reveals that between 2019 and 2023, nurse aides, orderlies, and patient service associates consistently made up the highest proportion of disabling injury claims in Alberta.
In 2023, this group accounted for 6.0% of all claims, followed by material handlers at 4.5% and retail salespersons at 4.3%.
Similarly, in 2019, the share of claims was 5.4% for nurse aides, orderlies, and patient service associates, 3.6% for material handlers, and 3.9% for retail salespersons.
Over the next few years, nurse aides, orderlies, and patient service associates maintained a leading share, rising to 7.9% in 2020 and peaking at 8.2% in 2022. By 2023, their proportion dropped slightly to 6.0%, but they remained the top group.
Meanwhile, material handlers saw steady yearly increases. From 3.6% in 2019, their share grew to 4.5% in 2020, 4.0% in 2021, 4.0% in 2022, and finally 4.5% in 2023.
Retail salespersons experienced more fluctuations in these numbers.
Their share was 3.9% in 2019, dipping to 3.6% in 2020, then rising modestly to 4.5% in 2021. The rate dropped again to 3.8% in 2022 before rising to 4.3% in 2023.
Nurse aides with injuries were mostly women aged 45 to 54, often working in continuing care facilities. Their injuries frequently involved back strain due to patient handling.
Material handlers were mostly younger men aged 25 to 34, employed in roles that required frequent lifting and moving of heavy materials. Their injuries often involved overexertion or poor ergonomic positioning.
Retail salespersons tended to be younger women, with 23% of injuries occurring in the 15 to 24 age group. These injuries were commonly linked to lifting or stocking activities in food or convenience stores.
| Year | Nurse Aides, Orderlies, and Patient Service Associates | Material Handlers | Retail Salespersons |
| 2019 | 5.40% | 3.60% | 4% |
| 2020 | 7.90% | 4.50% | 4% |
| 2021 | 5.80% | 4.00% | 4.50% |
| 2022 | 8.20% | 4.00% | 3.80% |
| 2023 | 6.00% | 4.50% | 4% |
Costs and Consequences of Accidents in Calgary
Accidents in Calgary, whether on roads or in the workplace, result in substantial economic burdens for the city.
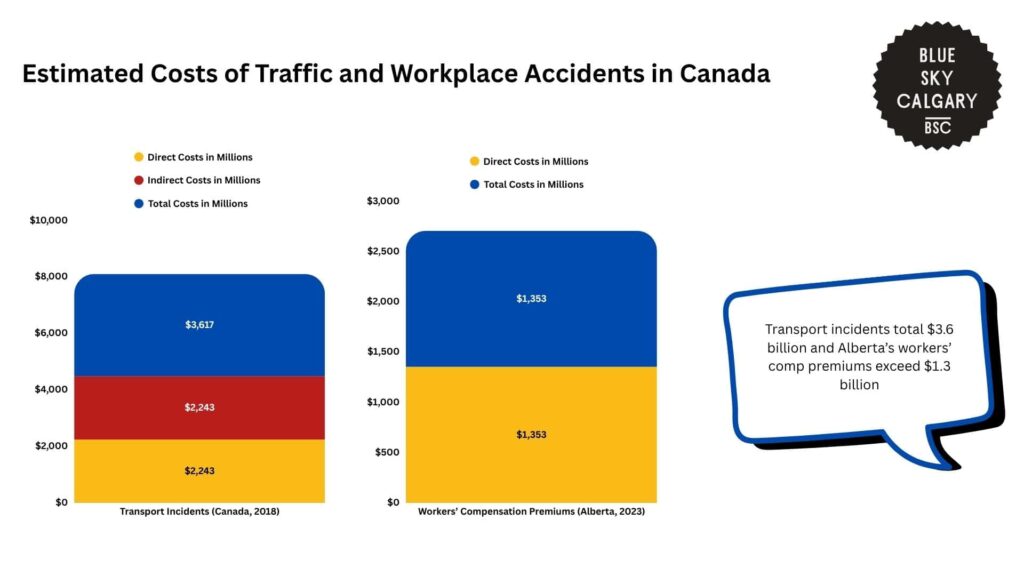
Statistics Canada reveals that the combined cost of transport-related incidents in the country totaled $3.6 billion in 2018.
This figure includes $2.2 billion in direct costs, such as emergency services, vehicle repairs, hospital bills, and legal proceedings.
An additional $1.4 billion stems from indirect costs, including lost productivity, long-term rehabilitation, and premature death.
OHS Canada also shows that in Alberta, work-related injuries carry significant financial consequences. In 2023, employers across the province paid a total of $1.35 billion in workers’ compensation premiums.
These premiums cover expenses related to medical treatment, wage replacement, and rehabilitation for employees hurt on the job.
The high cost reflects both the frequency and severity of workplace injuries across key sectors like healthcare, warehousing, and retail.
Beyond the financial impact, accidents have lasting human consequences. Injuries often lead to time off work, reduced quality of life, and long-term physical or psychological effects.
For businesses, these events can lead to labor shortages, increased insurance premiums, and other regulatory issues.
Together, these figures highlight that traffic and workplace accidents are not just safety issues but also major economic and social concerns for both Calgary and the wider Canadian population.
| Category | Direct Costs in Millions | Indirect Costs in Millions | Total Costs in Millions |
| Transport Incidents (Canada, 2018) | $2,243 | $1,374 | $3,617 |
| Workers’ Compensation Premiums (Alberta, 2023) | $1,353 | N/A | $1,353 |
Interventions and Solutions to Rising Accident Trends in Calgary
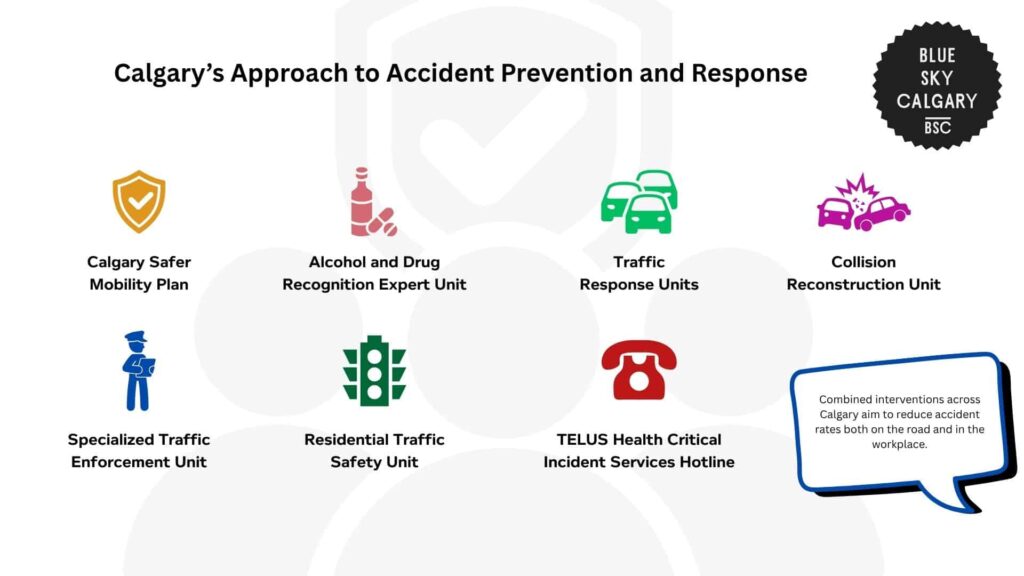
In Calgary, traffic and workplace safety are supported by a combination of targeted police operations, city planning efforts, and employee health support systems.
The Calgary Safer Mobility Plan maintains a specialized traffic section with multiple units focused on collision prevention and response.
Alongside this, the Alcohol and Drug Recognition Expert Unit runs public awareness programs and supports the enforcement of impaired driving laws.
Meanwhile, the Traffic Response Units handle serious injury and fatal collision investigations, while also managing commercial vehicle enforcement and checkstops.
This mobility plan also deploys a Collision Reconstruction Unit that provides detailed analysis for serious crashes, particularly those involving fatalities or hit-and-runs.
In addition, the Specialized Traffic Enforcement Unit monitors high-risk areas using intersection safety devices and photo radar to deter violations.
On the community side, the Residential Traffic Safety Unit focuses on public safety requests and neighborhood engagement.
For workplace incidents, Calgary has systems in place to support employees facing trauma.
TELUS Health offers a 24/7 Critical Incident Services hotline for city employees exposed to serious events like fatalities, multi-casualty incidents, or medical emergencies.
These services help mitigate the psychological impact of accidents, enabling affected staff to regain emotional stability and return to work safely.
Combined, these interventions show that Calgary takes a multi-layered approach to accident prevention and response, covering everything from road safety enforcement to trauma recovery and strategic planning.
The Future of Accident Trends in Calgary
Based on current trends, Calgary may continue to see mixed patterns in traffic and workplace accidents over the next few years.
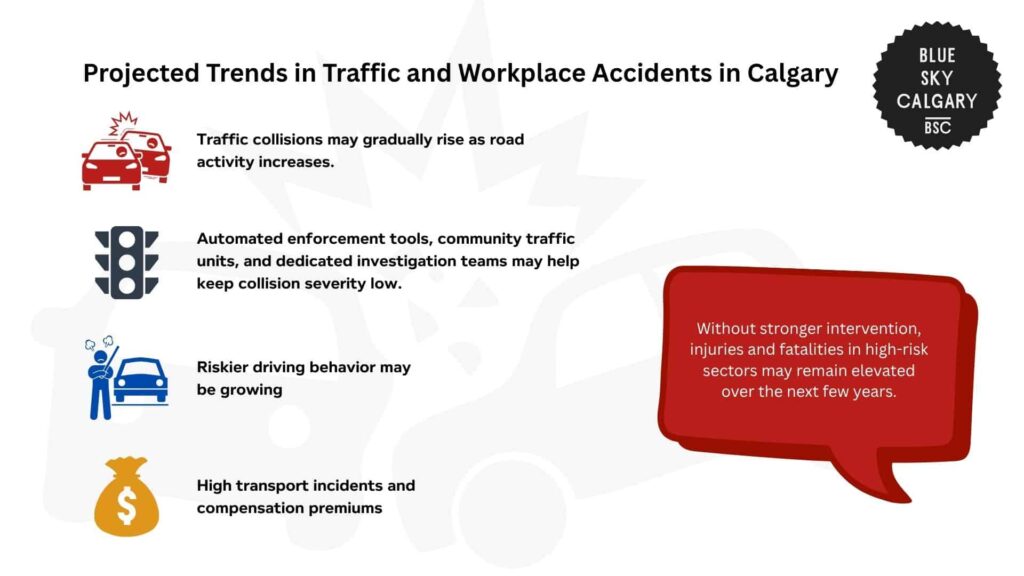
While overall traffic collisions dropped between 2019 and 2023, future rates may gradually rise as road activity increases.
The presence of automated enforcement tools, community traffic units, and dedicated investigation teams may help keep collision severity low.
However, fatal collisions increased in both traffic and motorcyclist categories despite overall volume declines, suggesting that riskier driving behavior may be growing. If this trend continues, fatality rates could remain elevated.
Meanwhile, workplace injury claims, especially among healthcare and physical labor industries, have held consistently high shares in recent years.
Unless significant improvements or redesigns are introduced in these sectors, disabling injury claims in these roles are likely to climb.
Financially, costs tied to transport incidents and compensation premiums are expected to remain high.
With Alberta employers already paying over $1.35 billion in workers’ compensation premiums annually and national transport incident costs exceeding $3.6 billion, accident-related expenditures may continue to rise.
Overall, while Calgary’s safety programs are promising, the data suggest that without continued investment, injury rates and costs could remain high or even grow in specific sectors like healthcare, transportation, and logistics.
References
- Government of Alberta. (2024). Alberta collision statistics 2023. Open Alberta. https://open.alberta.ca/dataset/25020446-adfb-4b57-9aaa-751d13dab72d/resource/3c0e3c0c-a3f4-4fd8-8e37-f71b99d3fc1b/download/tec-alberta-collision-statistics-2023.pdf
- Government of Alberta. (2024). Workplace injury, illness, and fatality statistics: Provincial summary 2023. Open Alberta. https://open.alberta.ca/dataset/4fb90b70-7660-4553-98fc-a59574f8fd5a/resource/0707b4e0-5431-4ec8-9a59-221f86cc9ff8/download/jet-workplace-injury-illness-fatality-stats-provincial-summary-2023.pdf
- Transport Canada. (2024). Canadian motor vehicle traffic collision statistics: 2023. Government of Canada. https://tc.canada.ca/en/road-transportation/statistics-data/canadian-motor-vehicle-traffic-collision-statistics-2023
- City of Calgary. (2024). Calgary mobility safety framework update. https://pub-calgary.escribemeetings.com/filestream.ashx?DocumentId=191251
- Public Health Agency of Canada. (2021). The cost of injury in Canada. Government of Canada. https://www.canada.ca/en/public-health/services/injury-prevention/cost-injury-canada.html
- Occupational Health & Safety Canada. (2023). The costs and risks of workplace injuries. https://www.ohscanada.com/features/the-costs-and-risks-of-workplace-injuries/
- City of Calgary. (n.d.). Traffic safety. https://www.calgary.ca/roads/safety.html
- City of Calgary. (n.d.). Critical incident stress management. https://www.calgary.ca/employees/critical-incident-stress-management.html