Calgary’s Housing Market: Statistics, Trends, and Challenges

Key Insights
| As per the Calgary Housing Market Report, the overall average sold price of all types of properties in Calgary was $605,026 in 2024. According to data from Spring Financial, the mean housing expense in Canada during 2023 was $657,145. The same report also found that Alberta’s mean price of $500,173 remained below the national mean of $657,145. Data from the Calgary Housing Market Report reveals that Calgary West had the highest benchmark house market price in Calgary in 2023 at $708,700. The Calgary Housing Needs Assessment 2023 reported that Calgary’s homeless population dropped by 4.6%, from 2,911 in 2018 to 2,782 in 2022. |
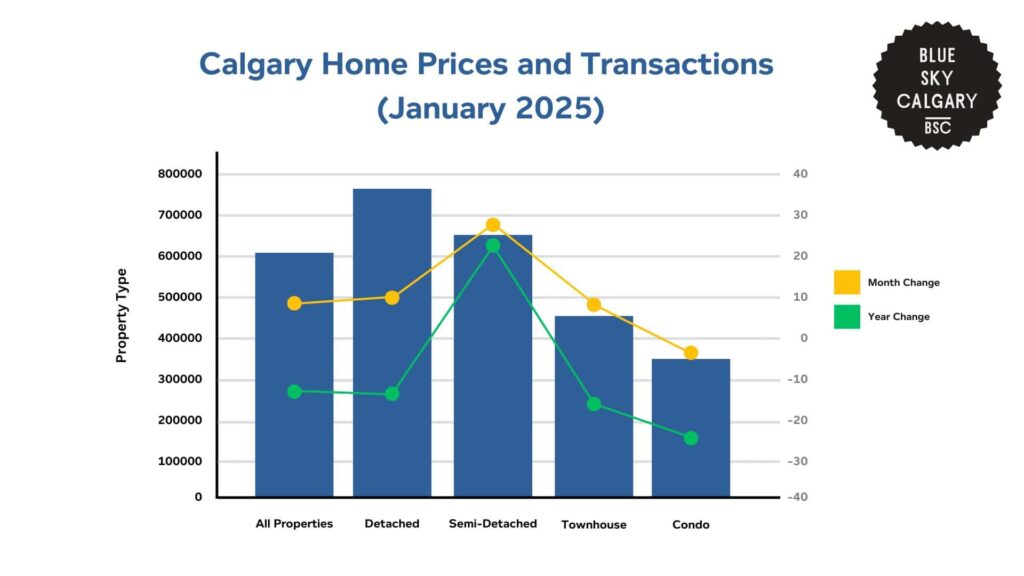
According to data from the Calgary Housing Market Report, the city’s housing market in January 2025 remained relatively stable, with home prices maintaining an upward trend year-over-year.
The average sold price across all property types reached $605,026 in 2024, reflecting a 6.3% increase compared to the previous year.
Meanwhile, the total number of transactions stood at 1,451, marking a 9.8% increase from the previous month but a 12.1% decline annually.
When breaking this down by property type, detached houses recorded an average sale price of $779,815, a 2.7% year-over-year rise but a 2.1% month-over-month fall.
Semi-detached houses stood at $667,063, a 1.7% month-over-month rise but a 0.1% year-over-year drop.
Townhouses and condo apartments also posted a positive trend, with townhouses increasing 6.0% year-over-year to $465,712 and condos growing 4.7% year-over-year to $352,799.
On the sales side, transactions in detached homes increased 10.0% month to month but decreased 8.2% year to year.
Semi-detached homes had a 29.0% month-to-month rise in transactions and were the best-performing segment, with a 22.1% increase annually.
Townhouses and condos experienced mixed results, as townhouse sales rose 8.3% monthly but decreased 16.8% year to year. Meanwhile, condo sales went up 3.6% month to month but decreased 24.2% from last year.
| Property Type | Avg. Sold Price | 1-Month Change | 1-Year Change | Transactions | 1-Month Change | 1-Year Change |
| All Properties | $605,026 | 0.0% | +6.3% | 1,451 | +9.8% | -12.1% |
| Detached | $779,815 | -2.1% | +2.7% | 674 | +10.0% | -8.2% |
| Semi-Detached | $667,063 | +1.7% | -0.1% | 160 | +29.0% | +22.1% |
| Townhouse | $465,712 | +3.9% | +6.0% | 247 | +8.3% | -16.8% |
| Condo | $352,799 | -1.6% | +4.7% | 370 | +3.6% | -24.2% |
Regional Analysis of Housing Trends Across Canada
According to Spring Financial, Canada’s housing market has experienced significant price fluctuations over the past decade, with notable increases in recent years.
The average housing cost in Canada in 2023 was $657,145, reflecting a decline of 6.64% from the peak cost of $703,875 in 2022.
However, the long-term trend remains upward, with prices increasing by 67.7% from 2013 ($391,820) to 2023 ($657,145).
On a provincial level, British Columbia recorded the highest average home price in December 2024 at $979,221, followed by Ontario at $868,067.
Alberta, Quebec, and Manitoba remained more affordable, with average prices between $395,000 and $500,173.
The most affordable provinces were Saskatchewan at $324,400 and Newfoundland and Labrador at $306,100.
| Year | Average Housing Cost (CAD) |
| 2013 | $391,820 |
| 2014 | $419,699 |
| 2015 | $413,000 |
| 2016 | $490,495 |
| 2017 | $496,500 |
| 2018 | $488,862 |
| 2019 | $502,811 |
| 2020 | $567,332 |
| 2021 | $688,096 |
| 2022 | $703,875 |
| 2023 | $657,145 |
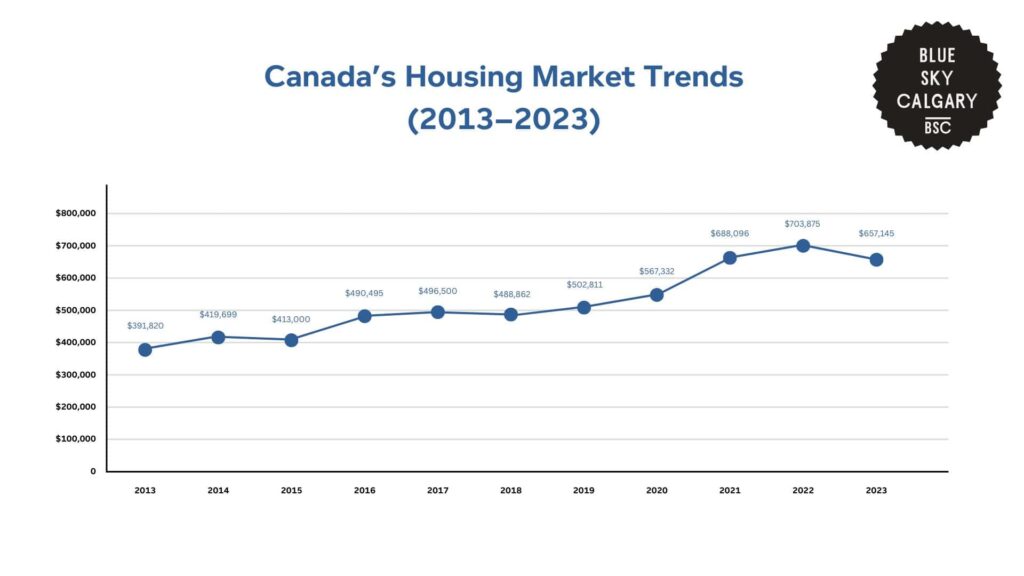
The report also shows a consistent rise in housing costs between 2013 and 2022, with a significant spike in 2021 to $688,096. This is a 21.3% rise from 2020.
However, the market in 2023 experienced a decline to $657,145, a 6.6% fall from the previous year. This recent decline could be due to reasons like increasing interest rates, affordability issues, and economic changes.
| Province/Territory | Average Home Price (CAD) |
| British Columbia | $979,221 |
| Alberta | $500,173 |
| Saskatchewan | $324,400 |
| Manitoba | $395,000 |
| Ontario | $868,067 |
| Nova Scotia | $402,200 |
| New Brunswick | $330,100 |
| Prince Edward Island | $404,741 |
| Newfoundland & Labrador | $306,100 |
| Quebec | $495,200 |
| Northwest Territories | $422,787 |
| Nunavut | $550,000 |
| Yukon | $661,400 |
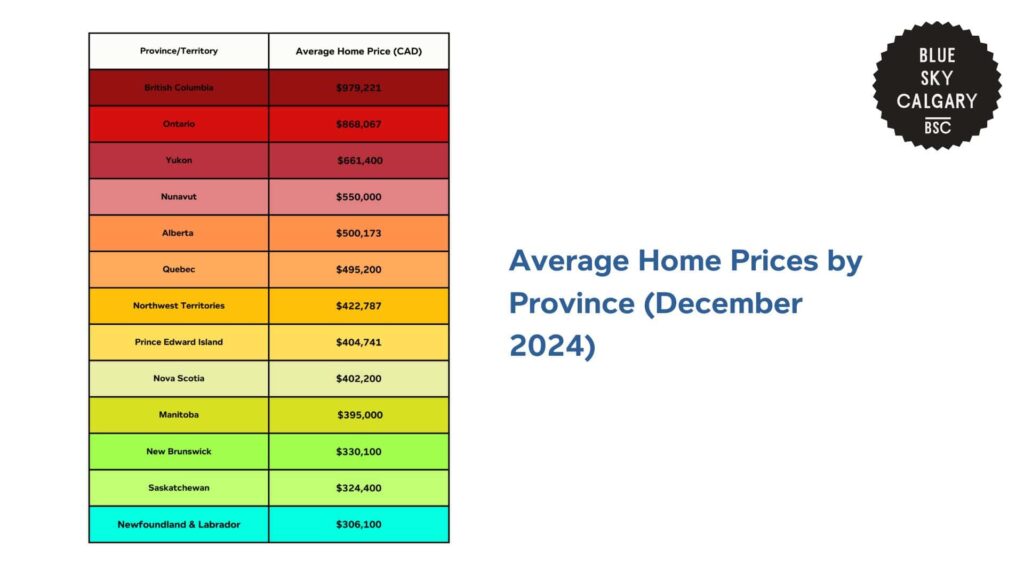
This map highlights sharp price differentials between provinces. British Columbia ($979,221) and Ontario ($868,067) continue to be the priciest housing markets because of great demand in metropolitan centers such as Vancouver and Toronto.
Notably, Alberta’s mean price ($500,173) is still under the national mean of $657,145, indicating a robust supply and a less overheated market.
Meanwhile, Quebec and Manitoba are also in a mid-range pricing category, with means of approximately $495,200 and $395,000, respectively.
City-Level Housing Trends in Calgary
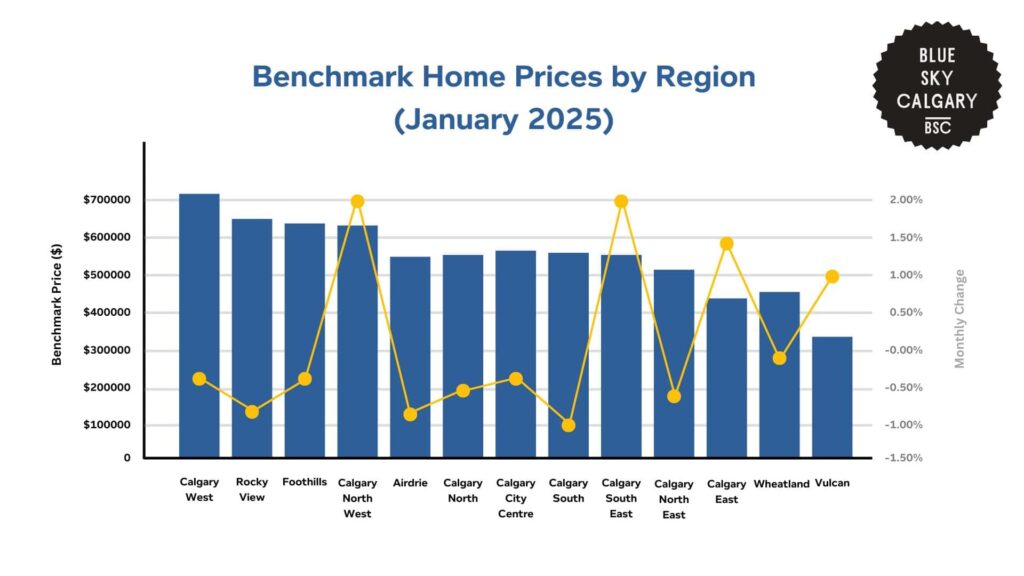
The Calgary Housing Market Report reveals that housing prices in the city and its surrounding areas showed mixed trends in January 2025.
Calgary West recorded the highest benchmark price at $708,700, followed by Rocky View at $648,000 and Foothills at $638,200.
Meanwhile, Vulcan had the lowest benchmark price at $329,600 but was also one of the few areas to see an increase (+1.0%).
Most areas experienced modest monthly declines, with Calgary East seeing the largest drop at -1.4 %. Calgary North West was the only urban area to record price growth (+2.0%), while Calgary South East also saw a minor increase (+0.2%).
These trends indicate relative stability in Calgary’s housing market, with higher-value areas seeing slight declines and more affordable regions experiencing growth.
| Area | Benchmark Price | Monthly Change |
| Calgary West | $708,700 | -0.4% |
| Rocky View | $648,000 | -0.7% |
| Foothills | $638,200 | -0.4% |
| Calgary North West | $634,600 | +2.0% |
| Airdrie | $537,300 | -0.9% |
| Calgary North | $548,400 | -0.5% |
| Calgary City Centre | $587,400 | -0.4% |
| Calgary South | $577,600 | -0.1% |
| Calgary South East | $576,100 | +0.2% |
| Calgary North East | $509,100 | -0.6% |
| Calgary East | $434,300 | -1.4% |
| Wheatland | $445,100 | -0.1% |
| Vulcan | $329,600 | +1.0% |
Homelessness and Demographic Trends in Calgary
The Calgary Housing Needs Assessment 2023 found that Calgary’s homeless population has declined by 4.6% over the past four years, from 2,911 individuals identifying as homeless in 2018 to 2,782 in 2022.
However, the percentage of women experiencing homelessness grew from 25% in 2018 to 32% in 2022, indicating a 28% rise in female homelessness over the same period.
The causes of homelessness are mostly financial uncertainty (28% reporting inadequate earnings), housing strife (28% reporting conflict with landlords or companions), and misuse of substances (13%).
| Year | Total Homeless Population | % Change from Previous Count |
| 1992 | 447 | – |
| 1993 | 461 | +3.1% |
| 1994 | 515 | +11.7% |
| 1996 | 988 | +91.9% |
| 1998 | 1,238 | +25.3% |
| 2000 | 1,737 | +40.2% |
| 2002 | 2,397 | +38.0% |
| 2004 | 3,157 | +31.7% |
| 2006 | 3,601 | +14.1% |
| 2008 | 3,333 | -7.5% |
| 2010 | 3,544 | +6.3% |
| 2012 | 3,222 | -9.1% |
| 2014 | 2,911 | -9.7% |
| 2016 | 2,911 | 0.0% |
| 2018 | 2,782 | -4.4% |
| 2022 | 2,782 | 0.0% |
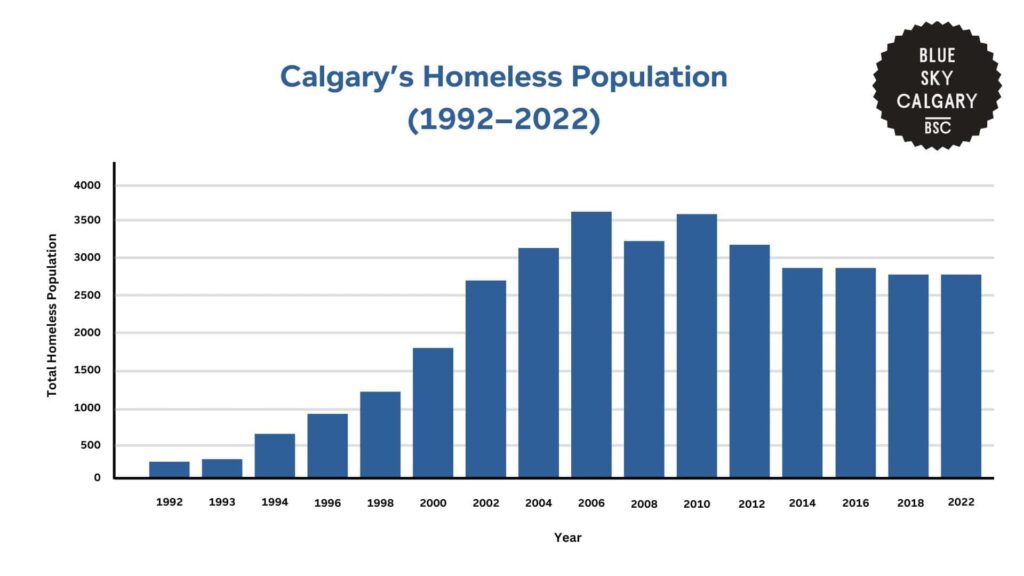
The report also found that Calgary’s homeless population expanded substantially between 1992 and 2008, by 641% over 16 years, from 447 in 1992 to 3,333 in 2008.
The growth was fastest between 1996 and 2006, during which homelessness increased more than threefold. Following the peak of 3,601 persons in 2006, the numbers started to fluctuate, with a slow decrease observed from 2012 onwards.
By 2022, homelessness had fallen by 22.7% below its peak, likely due to the effects of policy intervention and support schemes.
| Group | Number of Individuals | Percentage of Homeless Population | Change from 2018 |
| Adults (25-64 years) | 2,170 | 78.0% | -2.5% |
| Youth (13-24 years) | 278 | 10.0% | +0.3% |
| Children (0-12 years) | 239 | 8.6% | +1.1% |
| Seniors (65+ years) | 100 | 3.6% | +1.0% |
| Identified as Female | 890 | 32.0% | +28.0% |
| Identified as Male | 1,835 | 66.0% | -9.6% |
| Unknown Gender Identity | 56 | 2.0% | – |
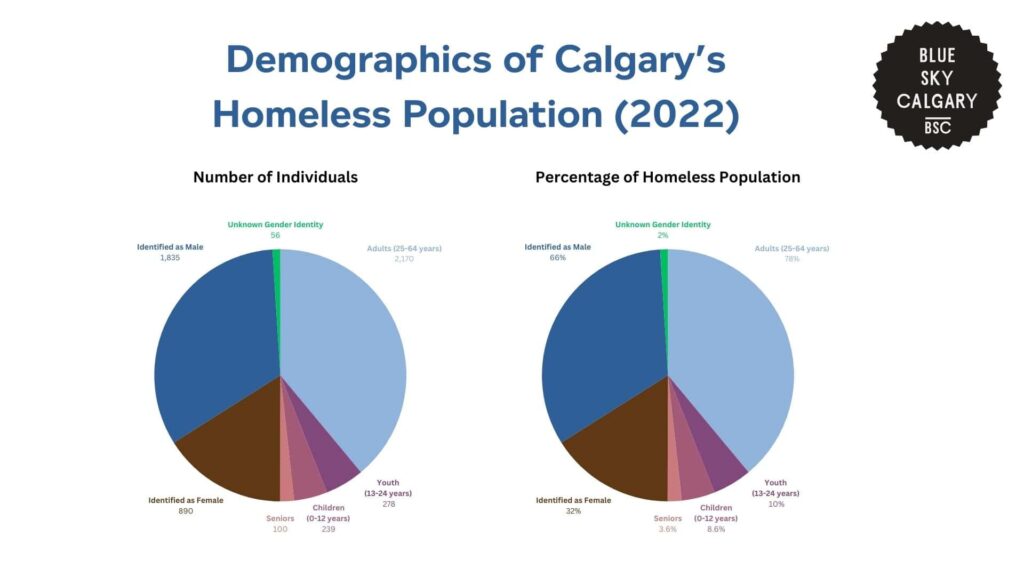
Homelessness in Calgary is most often experienced by adults aged 25 to 64, with 2,170 of this group comprising 78% of all homeless individuals.
Although this continues to be the largest age range, child and elderly homelessness has increased modestly, with children under 12 now at 8.6% and the elderly at 3.6%.
In comparison to 2018, there was a 1.1% increase in homelessness among children and a 1.0% increase among seniors, indicating the necessity for expanding family and elderly support services.
Moreover, the gender distribution in homeless trends also shows a dramatic change. Female homelessness rose by 28% between 2018 and 2022, with 890 women being homeless in 2022.
In contrast, the number of homeless men dropped to 1,835 individuals, a decrease of 9.6% compared to the last 5 years.
Costs and Consequences of Housing Issues in Calgary
Social Costs and Consequences
The City of Calgary found that Homelessness in the city results in pervasive social issues, such as enhanced health vulnerabilities, community disruption, and intergenerational poverty.
Individuals who are homeless are far more likely to have chronic diseases, mental illness, and drug and alcohol problems, yet they lack access to healthcare.
Homeless individuals are regularly released from hospitals with no permanent residence, which produces elevated re-admission rates and burdens emergency medical care.
In shelters, patients tend to receive less medical and psychological care, especially elderly persons who need extended care but do not have housing.
Homelessness also impacts safety and community cohesion. Without proper housing, individuals are more likely to become victims of victimization, violence, and exploitation, with special vulnerability among youth and women.
Young people between the ages of 13 and 24 constitute 10% of the homeless population in Calgary, exposing them to interrupted education and subsequent economic instability.
Social stigma for homelessness also further isolates individuals, and it becomes challenging for them to rejoin society, get jobs, or obtain long-term housing.
Economic Costs and Consequences
The economic cost of homelessness extends to government expenditures and overall economic output.
The City of Calgary’s Housing Needs Assessment found that emergency shelters, hospitalization, and police responses to homelessness are far more expensive than offering stable, permanent housing.
The cost of emergency shelter can be as high as $2,000 per individual per month, whereas supportive housing options are less than $1,000 per month.
Meanwhile, the ongoing use of emergency responses creates increased long-term costs, taking away from prevention and housing-first approaches.
This absence of affordable housing also disrupts workforce participation. Most people who are homeless are not able to hold stable jobs, which contributes to increased dependency on social welfare programs and lost economic output.
The impacts are particularly evident for youth, who tend to find it difficult to finish school as a result of unstable living conditions.
As rent costs in Calgary rose by 40% from 2020 to 2023, the number of families vulnerable to becoming homeless also grew, adding to economic stress on both families and public resources.
Interventions and Solutions to Housing Issues in Calgary
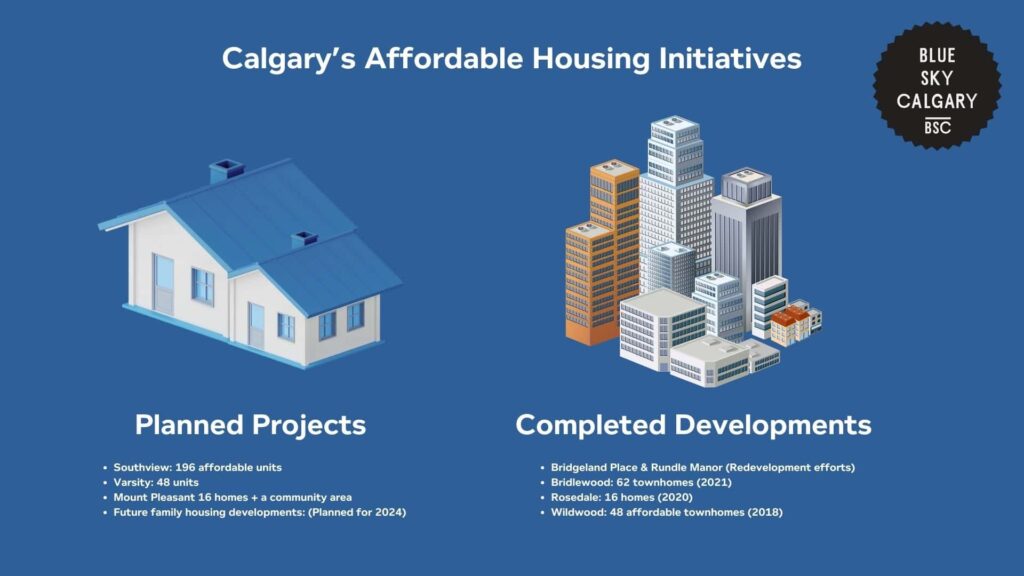
The City of Calgary has been expanding affordable housing through several projects aimed at increasing supply.
For example, Southview will contribute 196 affordable housing units, and Varsity will contribute 48 one-, two-, and three-bedroom homes. Mount Pleasant will include 16 homes and a community area, and family housing developments are planned for 2024.
The city is also redeveloping Bridgeland Place and Rundle Manor as part of the process of updating the current affordable housing inventory.
Some of the city-owned developments have also been accomplished, such as Bridlewood, which produced 62 townhome units in 2021, and Rosedale, which included 16 homes in 2020. Wildwood, opened in 2018, offers 48 families affordable townhomes.
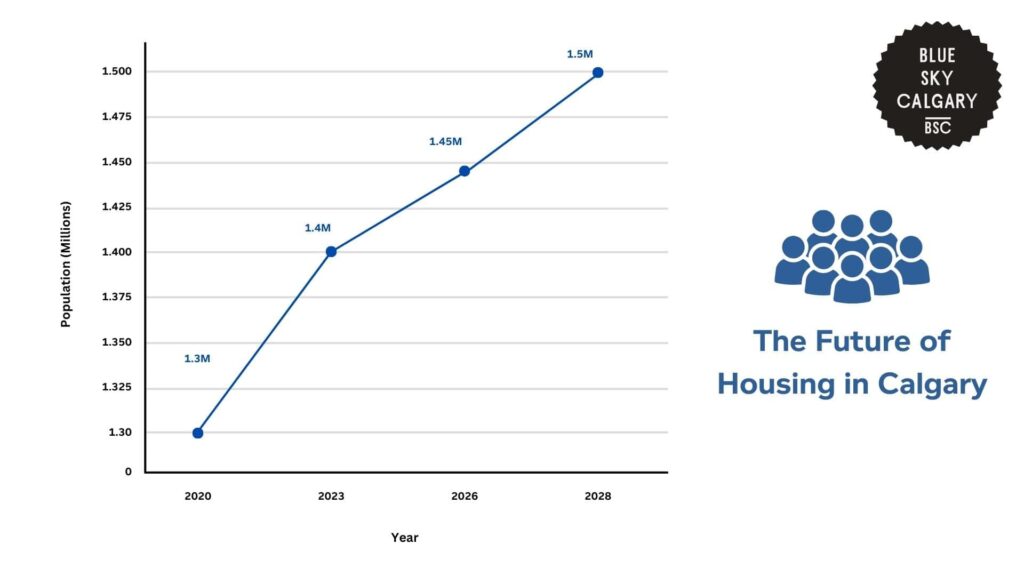
The Future of Housing in Calgary
The Calgary Housing Market Report predicts that Calgary’s population will grow to 1.5 million by 2028, putting even more pressure on the housing market.
The number of households with a housing need is anticipated to reach over 100,000 by 2026, almost twice as much as it was three decades ago.
Increased costs will also affect affordability. Between 2020 and 2023, Calgary’s average rent rose by 40%, and the median house price rose by 37% to $645,000.
To respond to these issues, the affordable housing stock needs to grow substantially. Although Calgary has grown its inventory of non-market housing by 25% since 2016, the city needs four times more affordable housing than is currently under construction.
If intervention is not made, homelessness and financial pressure will rise, further increasing the use of emergency shelters and social services.
References
- Calgary Housing Company. (n.d.). Development projects – Rundle Manor. Retrieved from https://calgaryhousingcompany.org/development-projects-rundle-manor/
- Calgary Real Estate Board. (n.d.). Daily housing summary. Retrieved from https://www.creb.com/Housing_Statistics/Daily_Housing_Summary/
- City of Calgary. (n.d.). Bridgeland Place redevelopment. Retrieved from https://www.calgary.ca/social-services/low-income/bridgeland-place-redevelopment.html
- City of Calgary. (n.d.). Housing needs assessment. Retrieved from https://www.calgary.ca/communities/housing-in-calgary/housing-needs-assessment.html
- Calgary Homeless Foundation. (2008). Report on the cost of homelessness in the City of Calgary. Retrieved from https://homelesshub.ca/resource/report-cost-homelessness-city-calgary/
- City of Calgary. (n.d.). Mount Pleasant affordable housing. Retrieved from https://www.calgary.ca/social-services/low-income/mount-pleasant-affordable-housing.html
- City of Calgary. (n.d.). Southview affordable housing. Retrieved from https://www.calgary.ca/social-services/low-income/southview-affordable-housing.html
- City of Calgary. (n.d.). Varsity affordable housing project. Retrieved from https://engage.calgary.ca/varsity
- City of Calgary. (n.d.). Welcome to the City of Calgary. Retrieved from https://www.calgary.ca/home.html
- Spring Financial. (n.d.). Average home prices in Canada. Retrieved from https://www.springfinancial.ca/blog/lifestyle/average-home-prices-in-canada