
Bicycle Theft Statistics in Calgary and How the City is Responding

Key Insights
| According to CBC News, Calgary experienced a total of 1,167 incidents of bike theft in 2021. A survey by The Best Bike reveals that around 81% of Canadian cyclists have experienced having at least 1 bike stolen from them. The same survey also shows that Calgary had a total of 176.6 bicycles stolen per 100,000 residents in 2022. Data from the Bike Index illustrates that within a single month in 2021, the estimated value of stolen bikes in Calgary amounted to $115,000. A 2020 initiative by the Bike Index and the City of Calgary allowed them to recover a total of 21.5% of stolen bikes. |
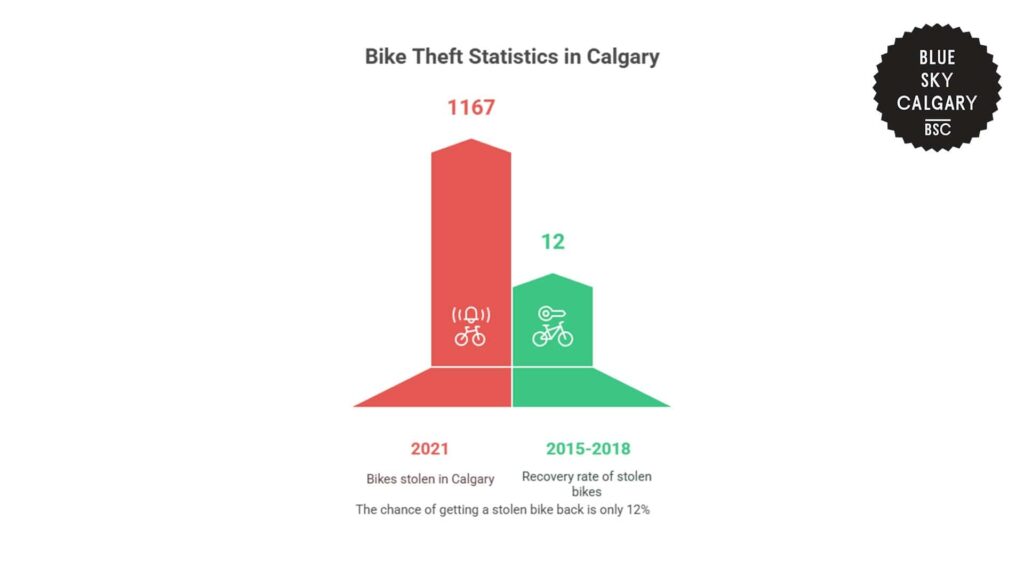
CBC News reports that in 2021, Calgary police had 1,167 reports of bike theft.
This rise in bicycle thefts has been attributed to the rising popularity of bikes and the fact that it is becoming increasingly easier for thieves to turn a profit due to online marketplaces.
The Calgary police also noted that the city has a long-standing issue with poor recovery rates for stolen bikes. Between 2015 and 2018, only a mere 12% of stolen bicycles were recovered by their owners.
That means that close to 9 out of every 10 reported stolen bikes were never found. This also indicates that bike theft remains a persistent and largely unsolved problem in the city.
With many residents using bicycles for transportation on a daily basis for things like commuting, recreation, or fitness, these crimes have varied economic and personal impacts.
| Metric | Year | Statistic |
| Number of bikes stolen in Calgary | 2021 | 1,167 |
| Chance of getting a stolen bike back | 2015 to 2018 | 12% |
A national survey also indicates that 81% of Canadian cyclists have had one or more bicycles stolen at some time, which is an overwhelming majority.
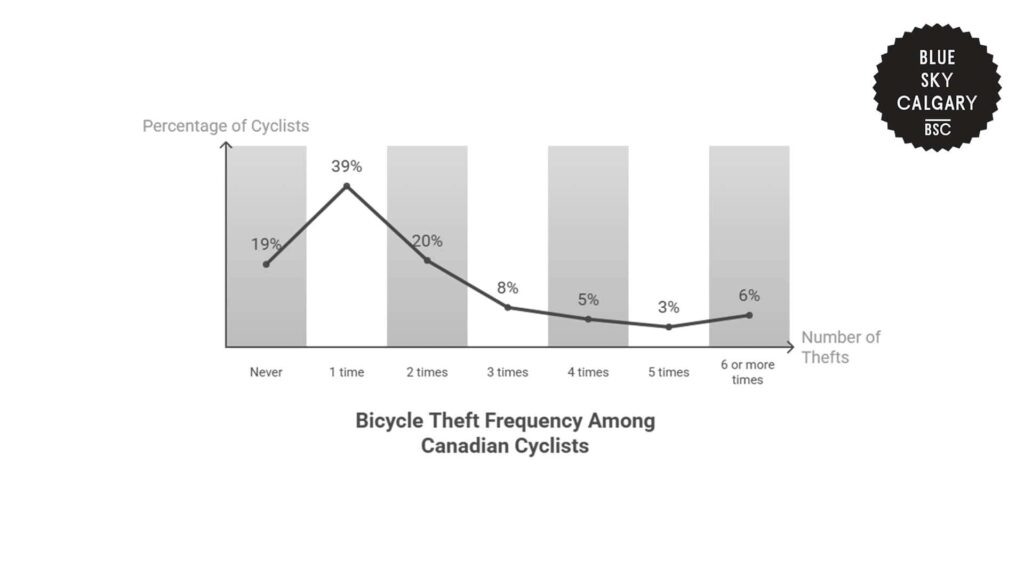
This also means that out of all the cyclists surveyed, only a mere 19% never experienced any occurrence of bike theft.
Among those who have experienced having their bike stolen, the most common occurrence was having one bike stolen, which was cited by 39% of cyclists.
Meanwhile, about 20% have had two bikes stolen, while another 8% said they have experienced this occurrence three times.
Smaller groups have faced even more frequent occurrences of bicycle theft, with 5% reporting four stolen bikes, 3% reporting five, and 6% saying they’ve had six or more bikes stolen.
These figures show that for many people, theft is not a one-time problem but something that happens again and again.
The statistics also point towards broader issues with the security of bikes and policing in most regions.
| Number of Times the Bike Was Stolen | Percentage of Cyclists |
| Never | 19% |
| 1 time | 39% |
| 2 times | 20% |
| 3 times | 8% |
| 4 times | 5% |
| 5 times | 3% |
| 6 or more times | 6% |
Regional Analysis of Bicycle Thefts Across Canada
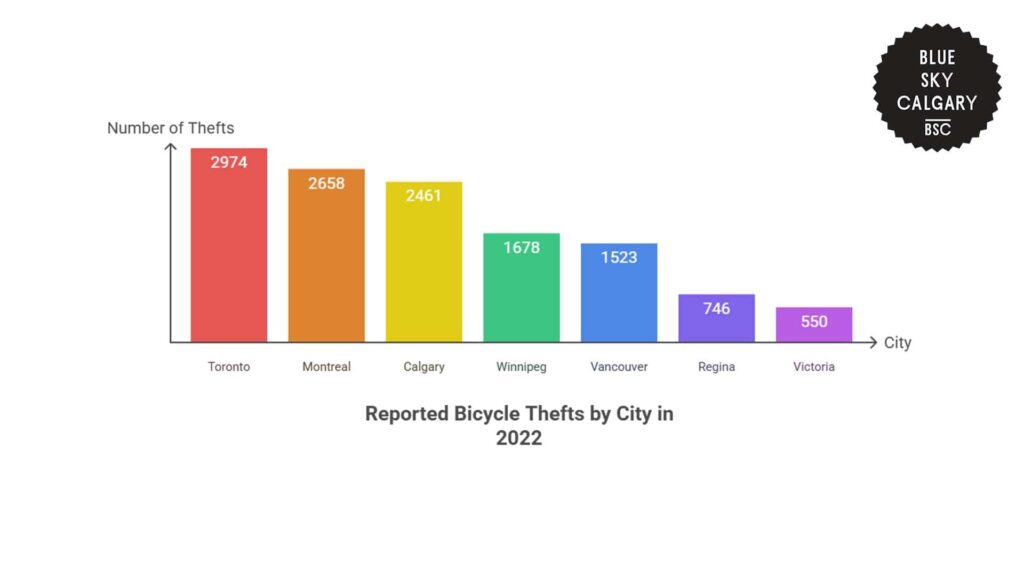
The Best Bike Lock shows that in 2022, Calgary had a total of 2,461 bike thefts. This ranked the city in third place for the highest number of reported bike thefts across Canada for that year.
Toronto and Montreal were the only other cities to register higher levels, with 2,974 and 2,658 stolen bikes, respectively. These three cities had the highest totals in the country as a whole, which shows how this problem is the most common in larger cities.
However, it is also important to note that larger cities have bigger populations, so this could explain why the raw numbers for bike theft occurrences are also higher in these cities.
Furthermore, the number of reports of thefts in Calgary was much higher than in Winnipeg, with 1,678 thefts, and in Vancouver, with 1,523. Calgary’s total was 46.6% higher than Winnipeg’s and 61.6% higher than Vancouver’s.
In Regina, the figures are much lower than Calgary’s, at only 746. Victoria had the lowest number recorded at 550.
Compared to Calgary, Regina’s total was 69.7% lower, while Victoria’s was 77.6% lower.
The large overall figure in Calgary might be due to a variety of factors. These include an increasing number of cyclists in recent years, limited secure parking facilities, and lower recovery rates for stolen bicycles.
| City | Reported Bike Thefts in 2022 |
| Toronto | 2,974 |
| Montreal | 2,658 |
| Calgary | 2,461 |
| Winnipeg | 1,678 |
| Vancouver | 1,523 |
| Regina | 746 |
| Victoria | 550 |
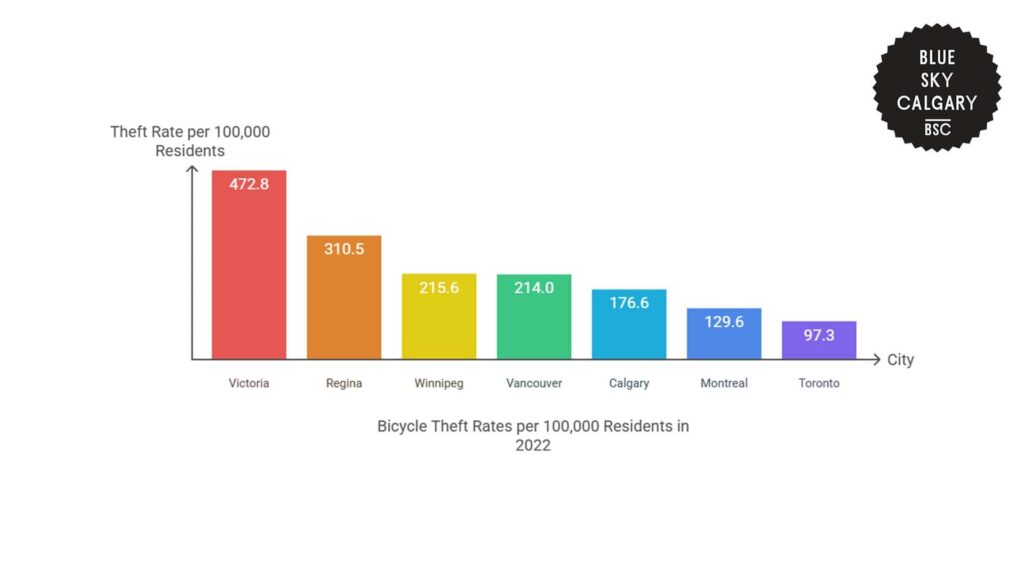
The data also shows the occurrences of bike thefts reported per 100,000 inhabitants in the city, to account for variations in city populations.
Thus, this changes the rankings of the cities considerably. Notably, Victoria recorded the most bike thefts in Canada during 2022, with 472.8 reported thefts per 100,000 inhabitants.
Regina ranked second with a rate of 310.5, followed by Winnipeg with 215.6 and Vancouver with 214.0. Calgary ranked fifth with 176.6 thefts per 100,000 citizens.
Montreal and Toronto, which experienced the greatest total amount of thefts, also had much lower rates per capita. Montreal had 129.6 thefts per 100,000 residents, while Toronto had the lowest rate among the cities listed at 97.3.
As a result, Calgary’s rate is 36% higher than Montreal’s and over 80% higher than Toronto’s. This shows that Calgary is at a moderate risk level for bicycle theft when compared to the other cities.
Overall, this indicates that although a greater number of bikes are stolen in larger cities, occurrences of theft are actually more common in smaller cities when considering population size.
| City | Reported Bike Thefts per 100,000 Residents |
| Victoria | 472.8 |
| Regina | 310.5 |
| Winnipeg | 215.6 |
| Vancouver | 214.0 |
| Calgary | 176.6 |
| Montreal | 129.6 |
| Toronto | 97.3 |
Trends in Bicycle Thefts in Calgary
A survey conducted by the Best Bike Lock reveals insights into bicycle theft trends in the city.
Common Locations of Bicycle Theft
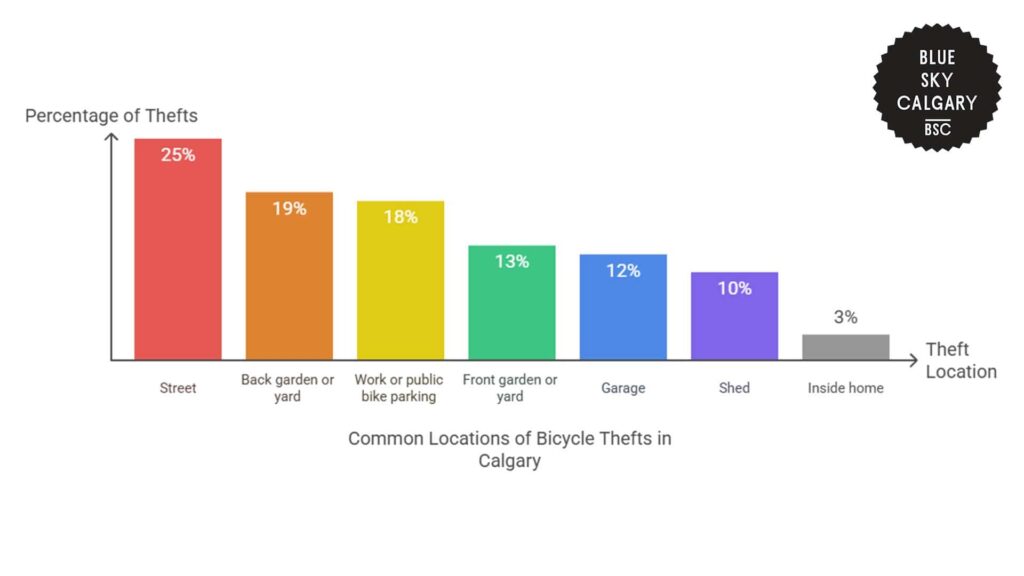
According to the data, bicycles are most frequently stolen from places that are public or have less security.
The most common place where stolen bikes were reported was on the streets, with 25% of stolen cycles.
This covers instances where bikes were locked to fences, racks, or posts in open public areas. These locations tend to be selected by cyclists for convenience, though the data shows that this also makes bikes more vulnerable to theft.
Another 19% of thefts occurred in back gardens or yards, suggesting that even private property without proper barriers or surveillance can be a target.
Similarly, workplaces and public bike parking areas accounted for 18% of thefts. This reflects the risk of leaving bikes unattended during working hours, even in designated parking zones.
Meanwhile, front yards made up a total of 13% of the cases, and garages comprised another 12%.
Sheds also comprised another 10% of the reported thefts. These are structures that are closed but may be simpler to enter or break into than homes or garages.
Finally, a total of 3% of bicycle thefts took place indoors, which is the least likely location.
Overall, the data alarmingly shows that 54% of the bicycles were stolen from the owner’s property, including yards, gardens, garages, and sheds.
The other 46% were taken from completely public or semi-public places, such as the street and parking spaces at work.
| Location | Percentage of Thefts |
| Street | 25% |
| Back garden or yard | 19% |
| Work or public authority bike parking | 18% |
| Front garden or yard | 13% |
| Garage | 12% |
| Shed | 10% |
| Inside home | 3% |
Trends in Locked and Unlocked Bicycle Thefts
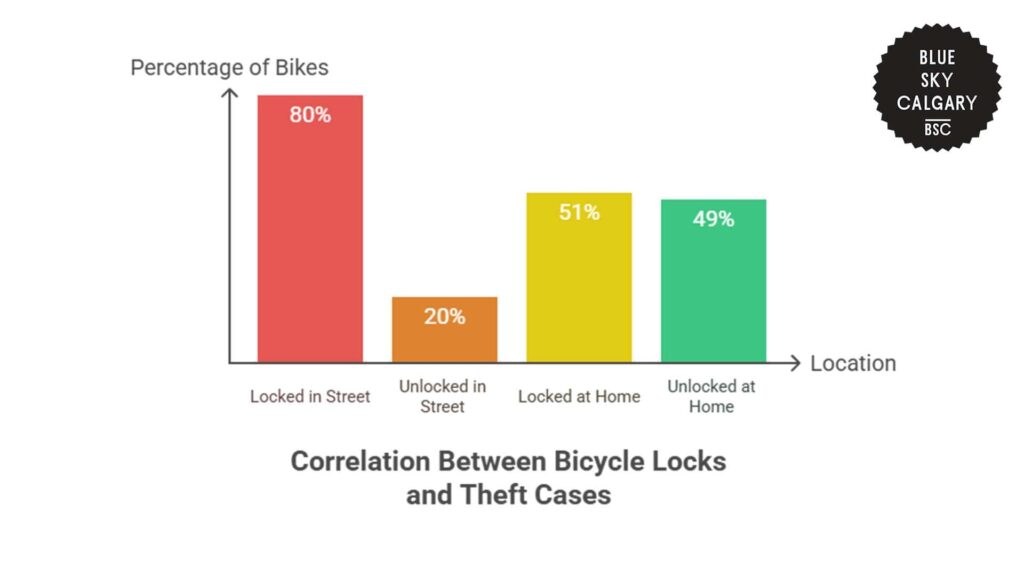
The data shows that 80% of bikes stolen from the street had been locked at the time they were taken.
This suggests that locks alone may not be enough to deter theft in open public spaces, particularly when thieves carry tools or work quickly in low-surveillance areas.
In contrast, the data shows a different pattern for bikes stolen at home. In those cases, only 51% were locked.
Although indoor or residential settings are generally seen as more secure, the data suggests that a lack of precaution still contributes significantly to cases of theft.
The comparison highlights a gap in how bike security is practiced depending on location. While most people lock their bikes in public, fewer take the same precautions at home.
However, bikes stored at home are not entirely safe from theft, especially when left in backyards, garages, or sheds.
| Location | Locked | Unlocked |
| In the street | 80% | 20% |
| At home | 51% | 49% |
Costs and Consequences of Rising Bicycle Theft Statistics in Calgary
CBC News shows that with the escalating prices of bicycles in Canada, the economic cost of theft is also rising.
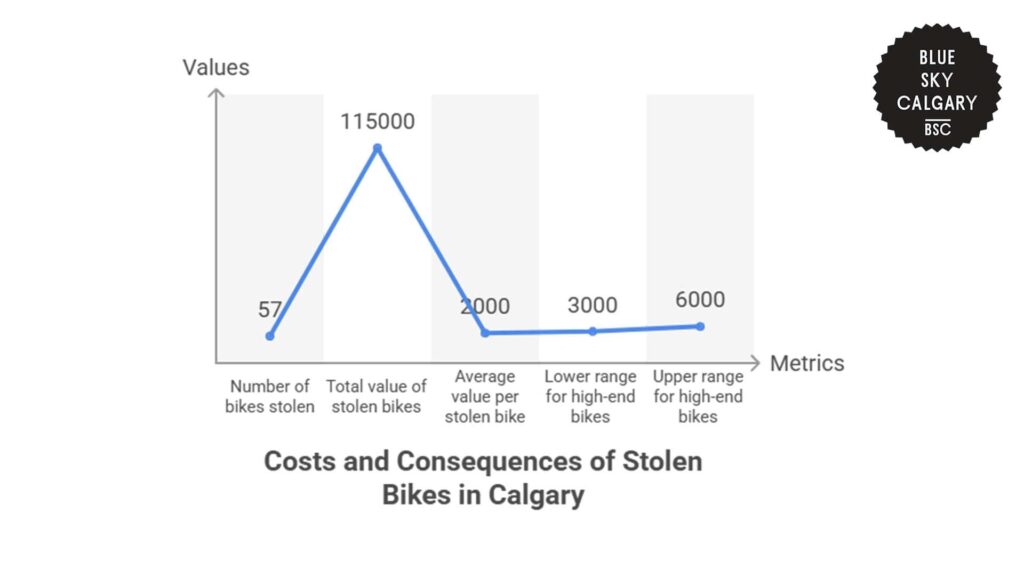
Statistics from the Bike Index reveal that within a single month in 2021, 57 stolen bicycles in Calgary were reported and had an estimated value of over $115,000. That is more than $2,000 per stolen bike on average.
Most of the units stolen were expensive mountain bikes with values ranging from $3,000 to $6,000.
The report also points out that there has been a rise in cases of theft involving more premium bicycles, like e-bikes. This means that these costs could rise even higher.
Beyond the direct economic losses due to theft, these statistics also illustrate how bicycle theft is not only an inconvenience for cyclists but also a huge financial burden for these people.
For individuals who use bicycles as a main means of transportation, the cost of replacing a stolen bike can result in unexpected financial hardship or mobility delays.
Since an increasing number of people now choose to bike to school, work, or other locations, cases of bicycle theft could then compromise a person’s studies or employment.
Rising theft cases also force cyclists to spend more on bicycle theft prevention methods. As bicycle theft cases rise, cyclists are forced to invest in more premium locks or better home security, which can be costly.
| Metric | Value |
| Number of bikes stolen | 57 |
| Total value of stolen bikes | $115,000+ |
| Average value per stolen bike | $2,000+ |
| Reported range for high-end bikes | $3,000 to $6,000 |
Interventions and Solutions to Rising Bicycle Theft Statistics in Calgary
In order to counteract low bike recovery rates and enhance theft outcomes, the City of Calgary joined forces with the Bike Index, a nonprofit bicycle registration website.
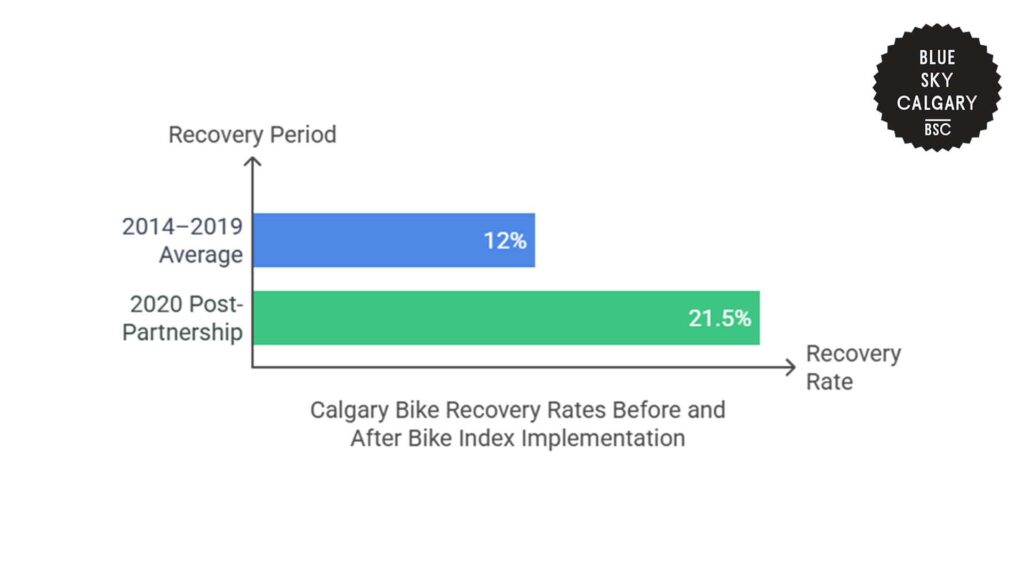
This initiative was initiated in June 2020 and has seen positive results since then. Before the partnership, Calgary’s average recovery rate for stolen bikes between 2014 and 2019 averaged only 12%.
However, in the first year since partnering with the Bike Index, that percentage increased to 21.5%. This means that the chances of recovering a stolen bike nearly doubled after just one year.
As a result, close to 16,000 bicycles have been registered on the site by residents of Calgary since the launch.
Overall, there were 212 bicycles successfully recovered in 2020 through the use of the registry. Another 336 bicycles were recovered by the Calgary Police Service (CPS), making the total number of recovered bicycles 548 for that year.
In total, the recoveries for that year were worth more than $339,000 USD.
Community outreach was the key to the program’s success. For example, the Calgary Police Service assisted the program through word-of-mouth recommendations to locals and public awareness campaigns through social media.
This resulted in over 700 registrations during peak cycling seasons. Local bike shops, bicycle clubs, and advocacy organizations also aided the initiative through registrations for customers and members, driving weekly numbers as high as 300.
Beyond this, the cost-effectiveness of the program has also encouraged more cyclists to register since registering on the website is free.
Thus, this program would not cost cyclists anything at all, but it would act as an additional safeguard for their bicycles.
| Metric | Value |
| Average recovery rate (2014–2019) | 12% |
| Recovery rate post-partnership (2020) | 21.5% |
| Bikes registered since launch | ~16,000 |
| Bikes recovered via Bike Index (2020) | 212 |
| Additional CPS recoveries (2020) | 336 |
| Total value of recovered bikes | $339,000 USD |
| Average return per registered owner | $21 |
The Future of Bicycle Theft Statistics in Calgary
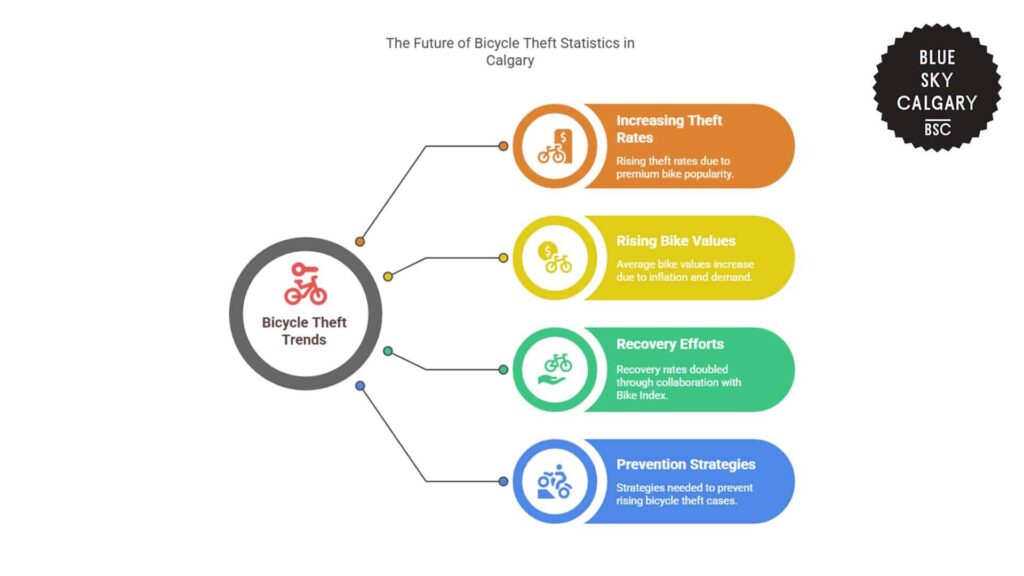
Based on recent trends, Calgary can expect to experience ongoing problems with bicycle theft in the coming few years, especially in months when cycling is most active.
Furthermore, the average value of stolen bikes continues to increase. It is expected that these costs will continue to rise due to the growing popularity of premium bicycles and e-bicycles, along with inflation and persistent supply chain challenges.
If this trend continues, this could create more incentives for thieves and potentially drive up bicycle theft rates even more.
However, the success of recovery efforts offers positive results for the city. Already, the city’s collaboration with the Bike Index has doubled recovery rates, from 12% to 21.5% in just one year.
With increased promotion, more local registration initiatives, and further support from the municipal government, recovery rates may rise even higher.
If recovery goes up more in the next few years, over thousands of bikes per year could be recovered from thieves.
Still, there is a need for citywide strategies to combat theft itself, in order to prevent the rise of bicycle theft cases. These strategies could include more secure bike parking, improved security in public spaces, and stricter law enforcement.
Without these initiatives, Calgary may see a rise in recovery rates, but bicycle thefts are also likely to increase.
References
- CBC News. (2022, April 22). Calgary police say bike thefts remain high, with low recovery rates. https://www.cbc.ca/news/canada/calgary/calgary-bicycle-theft-police-1.6421724
- The Best Bike Lock. (n.d.). Bike theft statistics Canada. https://thebestbikelock.com/bike-theft-statistics-canada/
- Bike Index. (2021, April 8). Calgary doubles bike recovery rate with Bike Index. https://bikeindex.org/news/calgary-doubles-bike-recovery-rate-with-bike-index
- Global News. (2023, July 16). ‘It’s a nightmare’: Bicycle theft on the rise across Canada during summer months. https://globalnews.ca/news/9817117/bicycle-thefts-canada-summer-2023/
- Rize Bikes. (2025). The state of bike theft in 2025: What you need to know. https://rizebikes.ca/blogs/blog/the-state-of-bike-theft-in-2025-what-you-need-to-know
- Bike Index. (n.d.). Bike Index: Free bicycle registration. https://bikeindex.org/
- City of Calgary. (n.d.). City of Calgary homepage. https://www.calgary.ca/home.html